




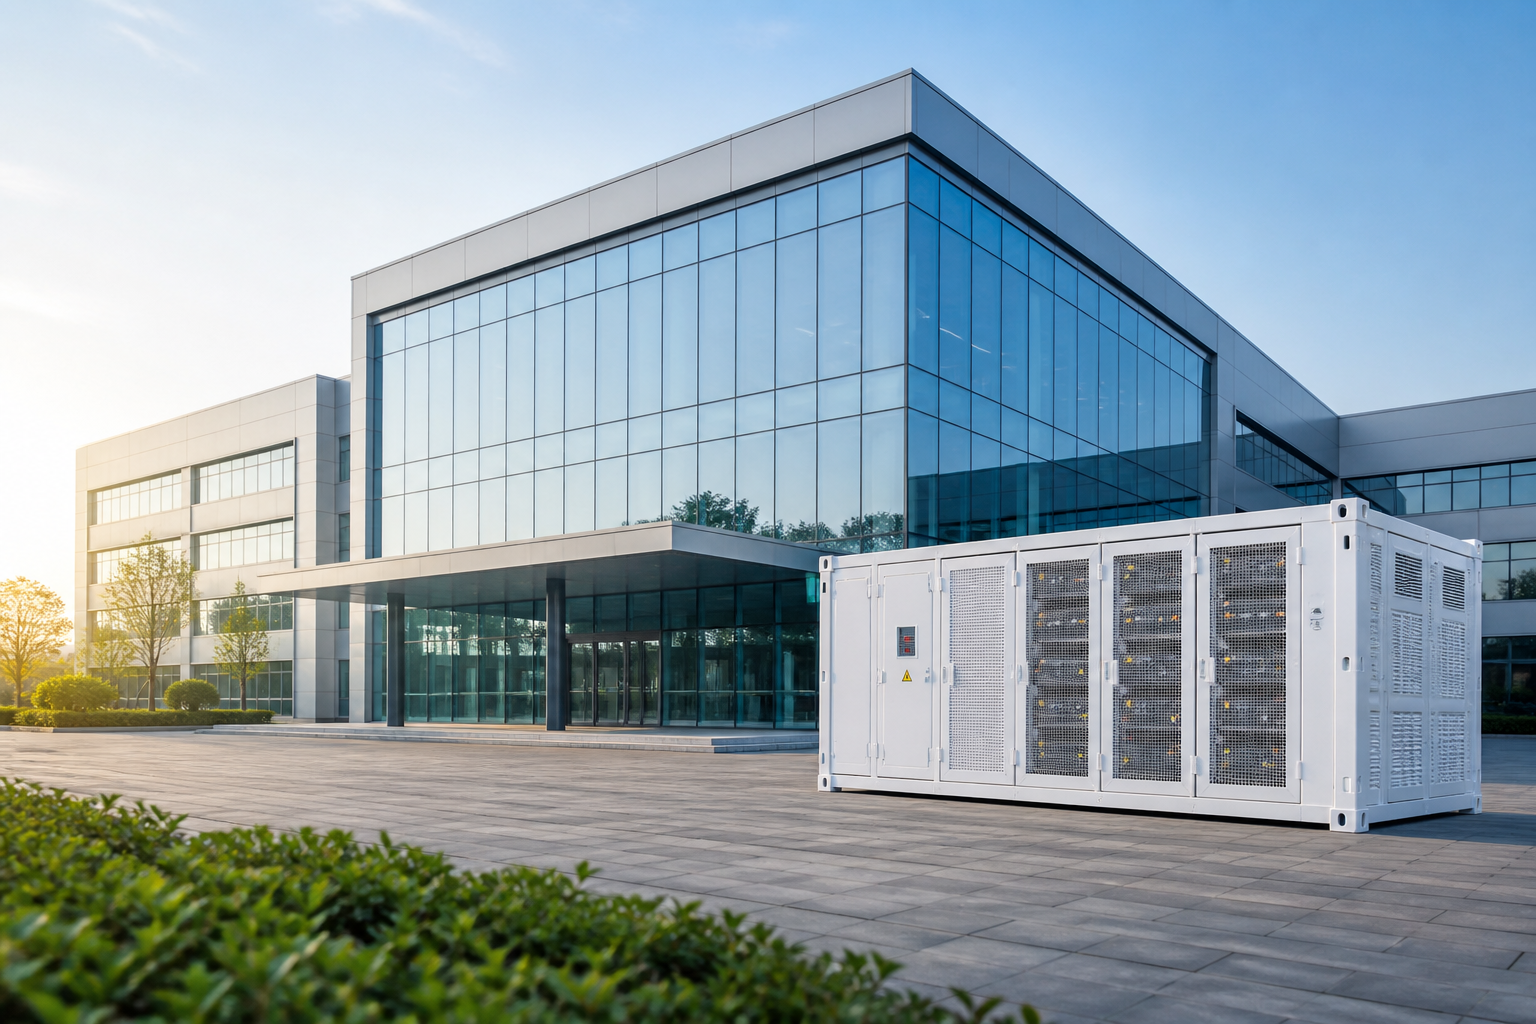
Grid Emulator
CHARGE & DISCHARGE TESTING
Let every megawatt of power and every
megawatt-hour of energy be verified against real operating curves
Under a 10–90% SOC window and 1.25 MW operating condition, verify capacity, efficiency, power response, rack consistency, thermal state, and time synchronization—and bind all results to one metering boundary and test-evidence chain.
Performance is not a nameplate number—it is a repeatable, reconcilable, and traceable closed-loop test.
Energy path and measurement boundary
0.25
Power Conversion
DC Boundary
Current / Voltage
Battery Boundary
Time sync:
PTP / IEEE 1588, the measurement chain time difference requires & lt; 1 ms; AC side, DC side, Battery side and Auxiliary energy consumption must use the same time frame to perform the energy reconciliation.
Full circulation power and SOC time axis
How do 15 Racks keep up?
Rack current
Rack current consistency.
≤0.8%
Rack SOC Condense
Maximum deviation
0.8%
Single-body voltage Dispersion
Max.
27 mV
Thermal response and cooling costs
Rack average temperature
30.9°C
30.9°C
Peak
34.6°C
34.6°C
Temperature zone
27.2°C
27.2°C
Efficiency and available energy books Within metering boundaries
Energy Path
AC Charge Input
4.35
MWh
DC Battery Charge
4.18
MWh
Delivery of DC energy
4.07
MWh
Delivery of AC energy
4.04
MWh
PCS losses
0.10
Battery damage
0.11
Wire/switch
0.01
Cooling auxiliary.
0.083
Dynamic and Power Responsive
Step Response (Target ± 1.25 MW)
90% Response: 620 ms
Power constraints and sustainability
±1.25 MW for continuous operation & lt; 0.6%
Three-cycle repetition and receiving window
Three complete cycles SOC/ Power Overlay
Available Energy (DC)
Mean
4.07 MWh
Repeatability
±0.42%
Maximum deviation
0.04 MWh
Receiving window and determination
| Item | Request | Result | Decision |
|---|---|---|---|
| Continuous Power | ±1.25MW | 1.25MW | PASS |
| DC Energy | ≥4.06MWh | 4.07MWh | PASS |
| Rack SOC Consistency | ≤1.0% | 0.8% | PASS |
| Max. | ≤30mV | 27mV | PASS |
| AC Efficiency | ≥90% | 92.9% | PASS |
| DC Efficiency | ≥95% | 97.4% | PASS |
Performance evidence kit
PLAN
Test plan
Charge / Discharge Plan
CURRENT
CAL
Certificate of metering equipment
Calibration
VALID
SYNC
Sync and Time Verify
PTP Evidence
PASS
ACDC
AC/DC Energy Book
Energy Ledger
PASS
RACK
Rack Consistency
15 Rack Comparison
PASS
IR
Thermal imaging and temperature
Thermal Evidence
PASS
NCR
Abnormal treatment
NCR-2608-0086
CLOSED
PDF
Test report
Signed Report
APPROVED
Release to aging & functional verification The performance cycle is closed.
Standards and internal norms Performance test background
Measurement principles:
All capacity, energy, efficiency and dynamic response conclusions must clearly measure boundaries, equipment calibration status, time synchronization status and valid data windows; any marked
INVALID FOR ACCEPTANCE
Data should not enter formal performance conclusions.