
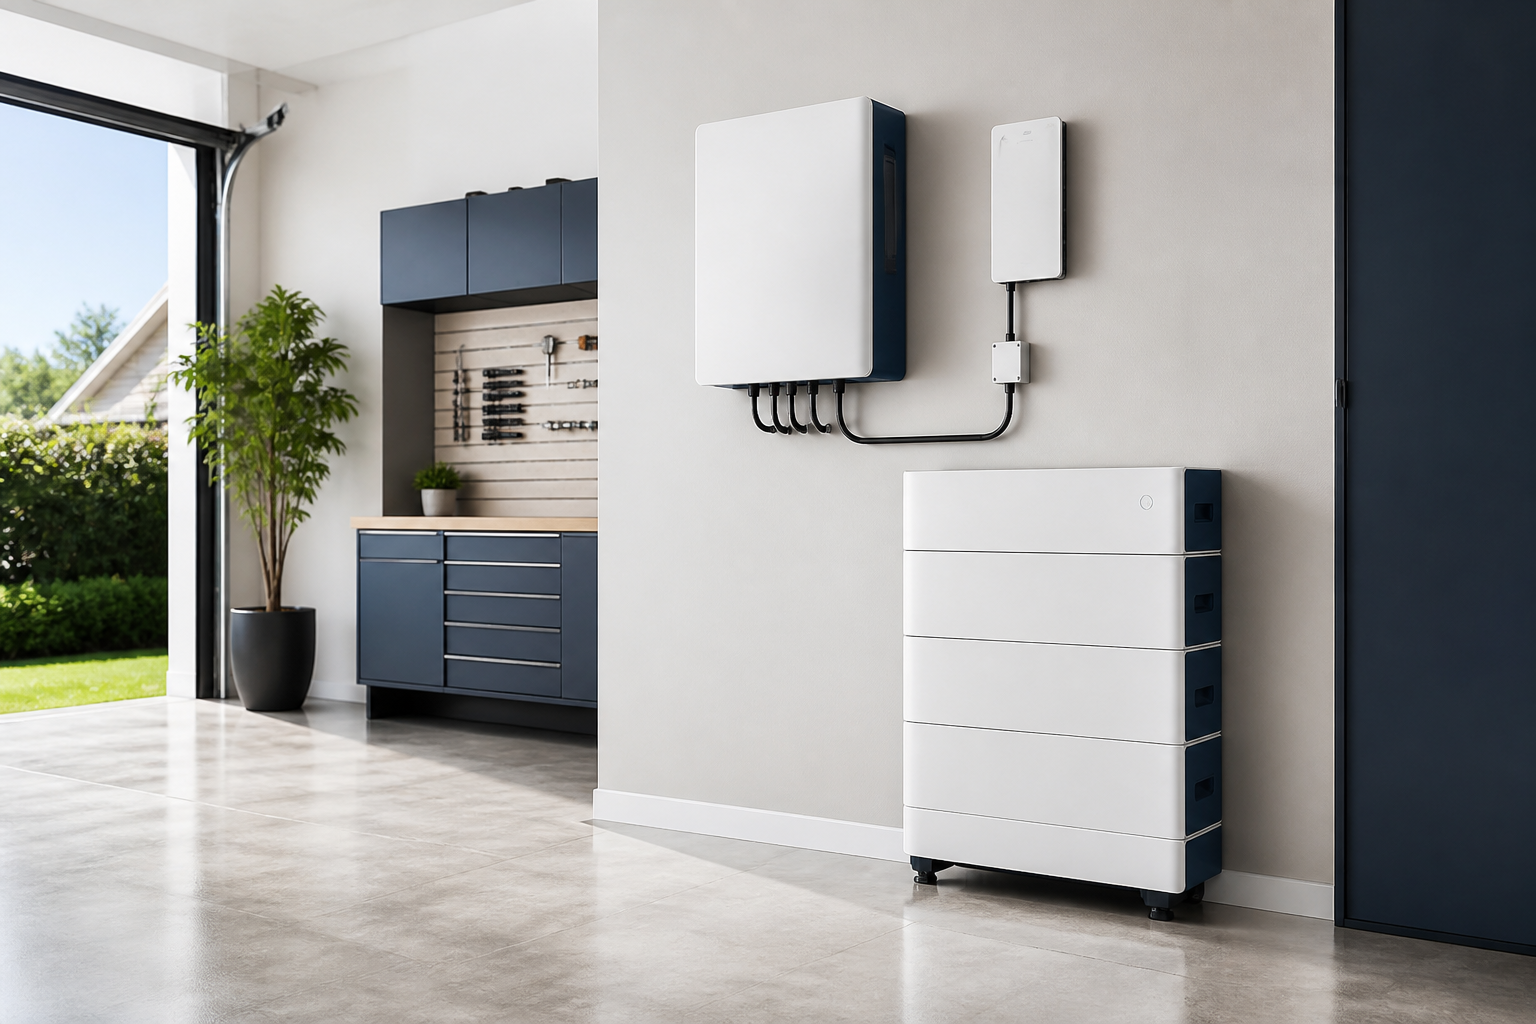
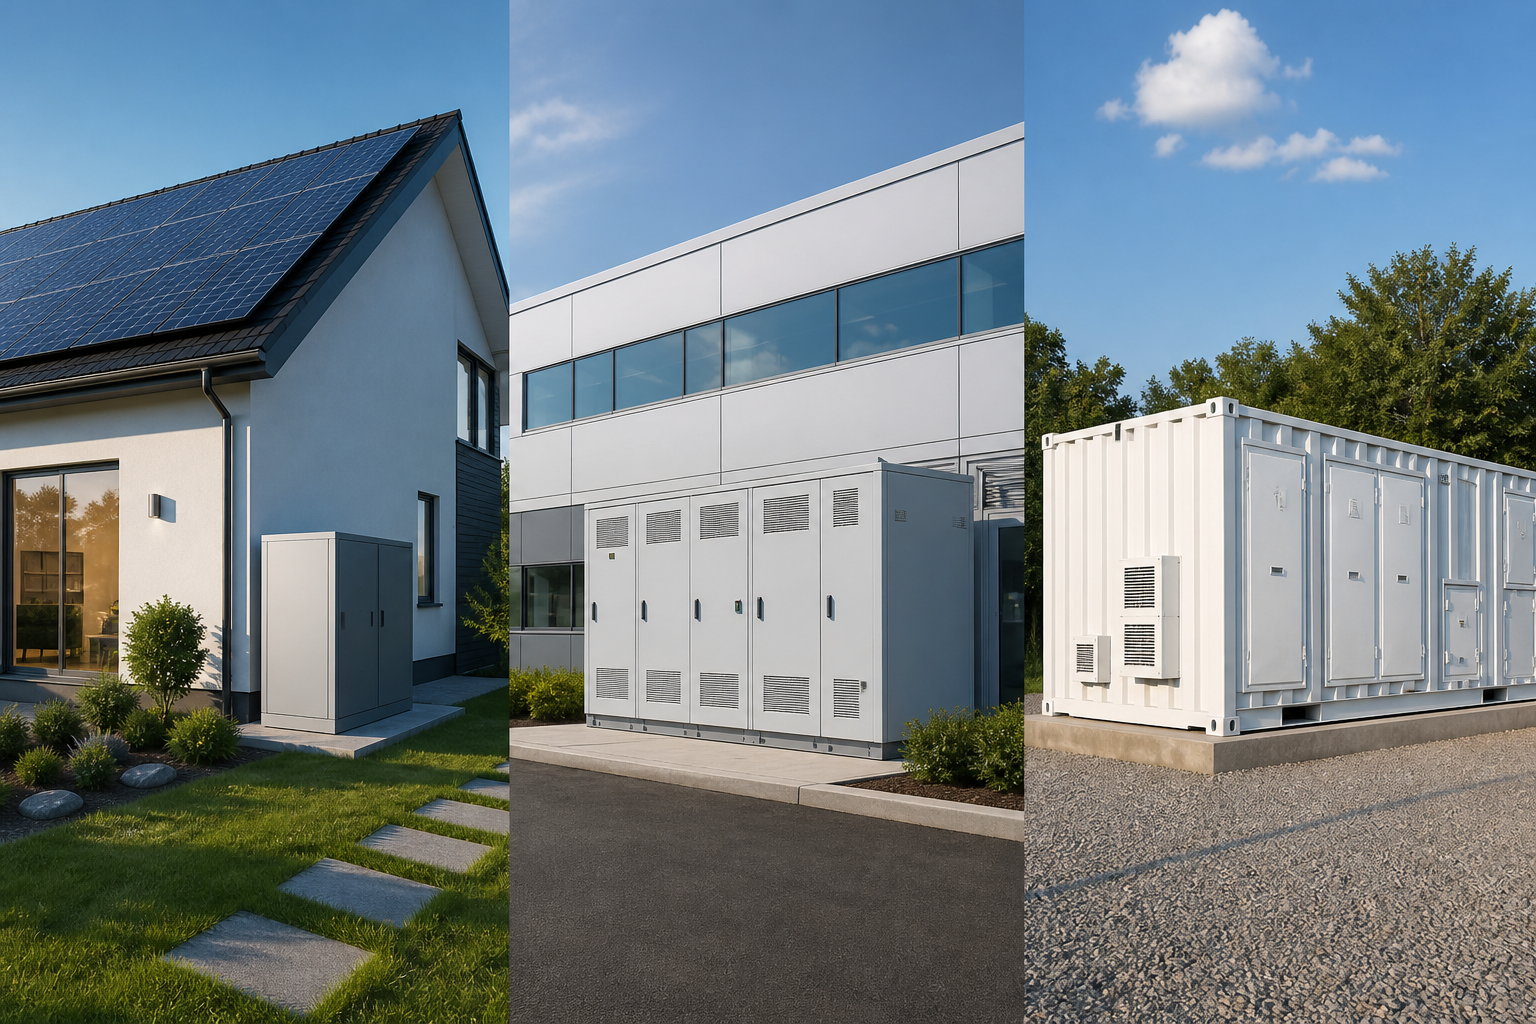
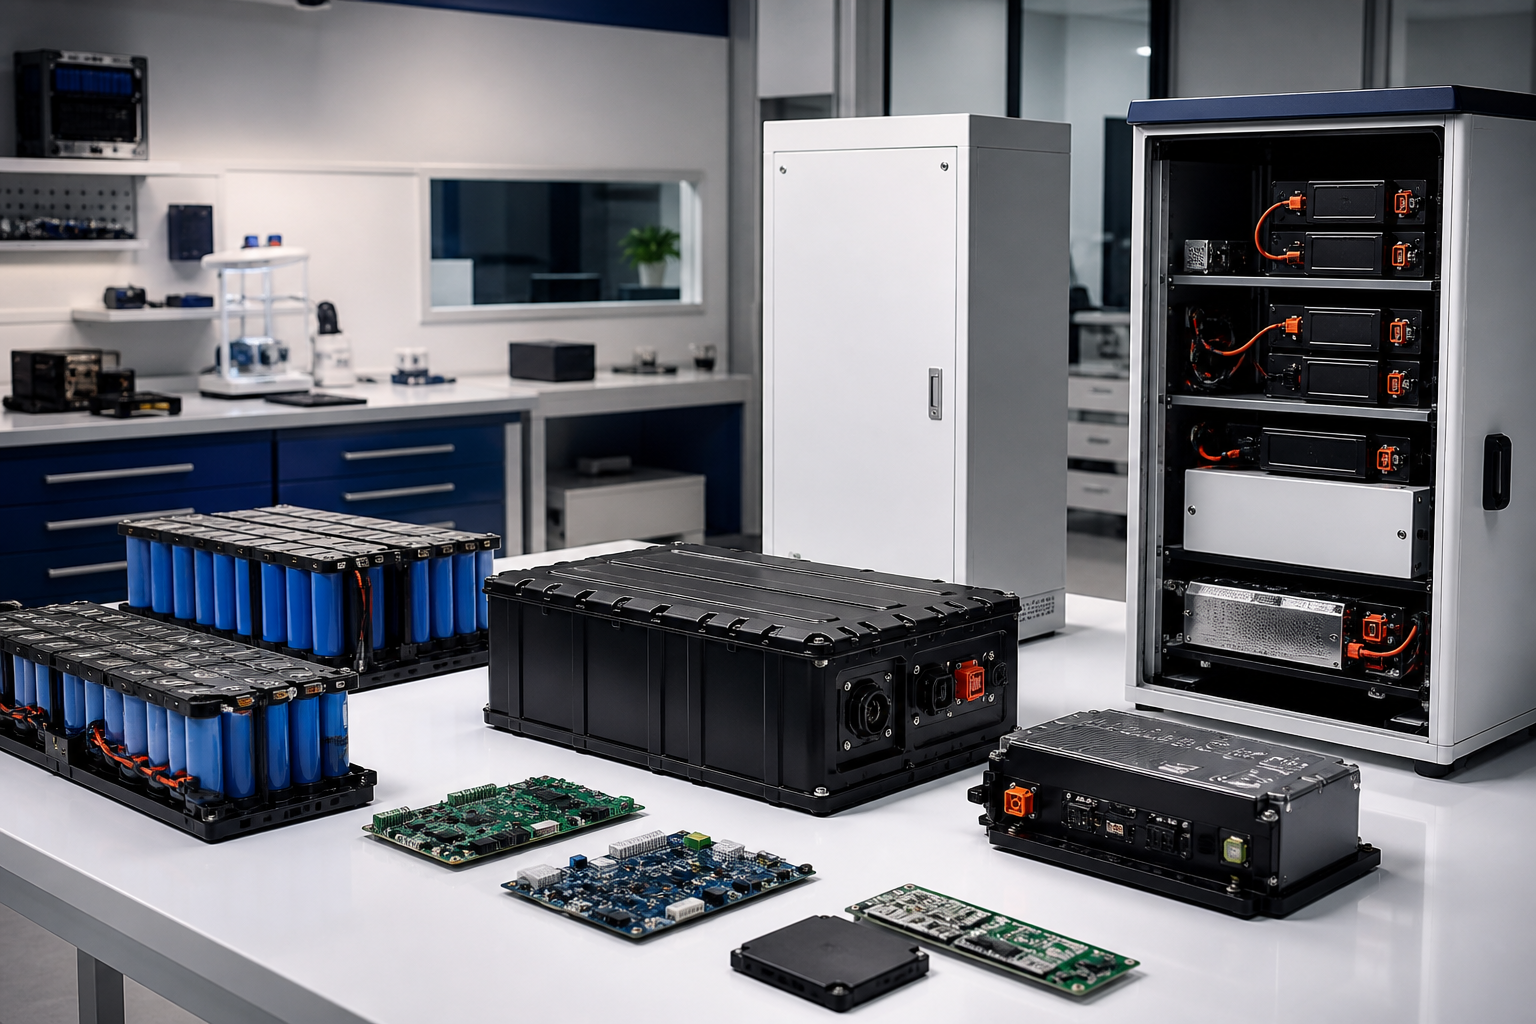


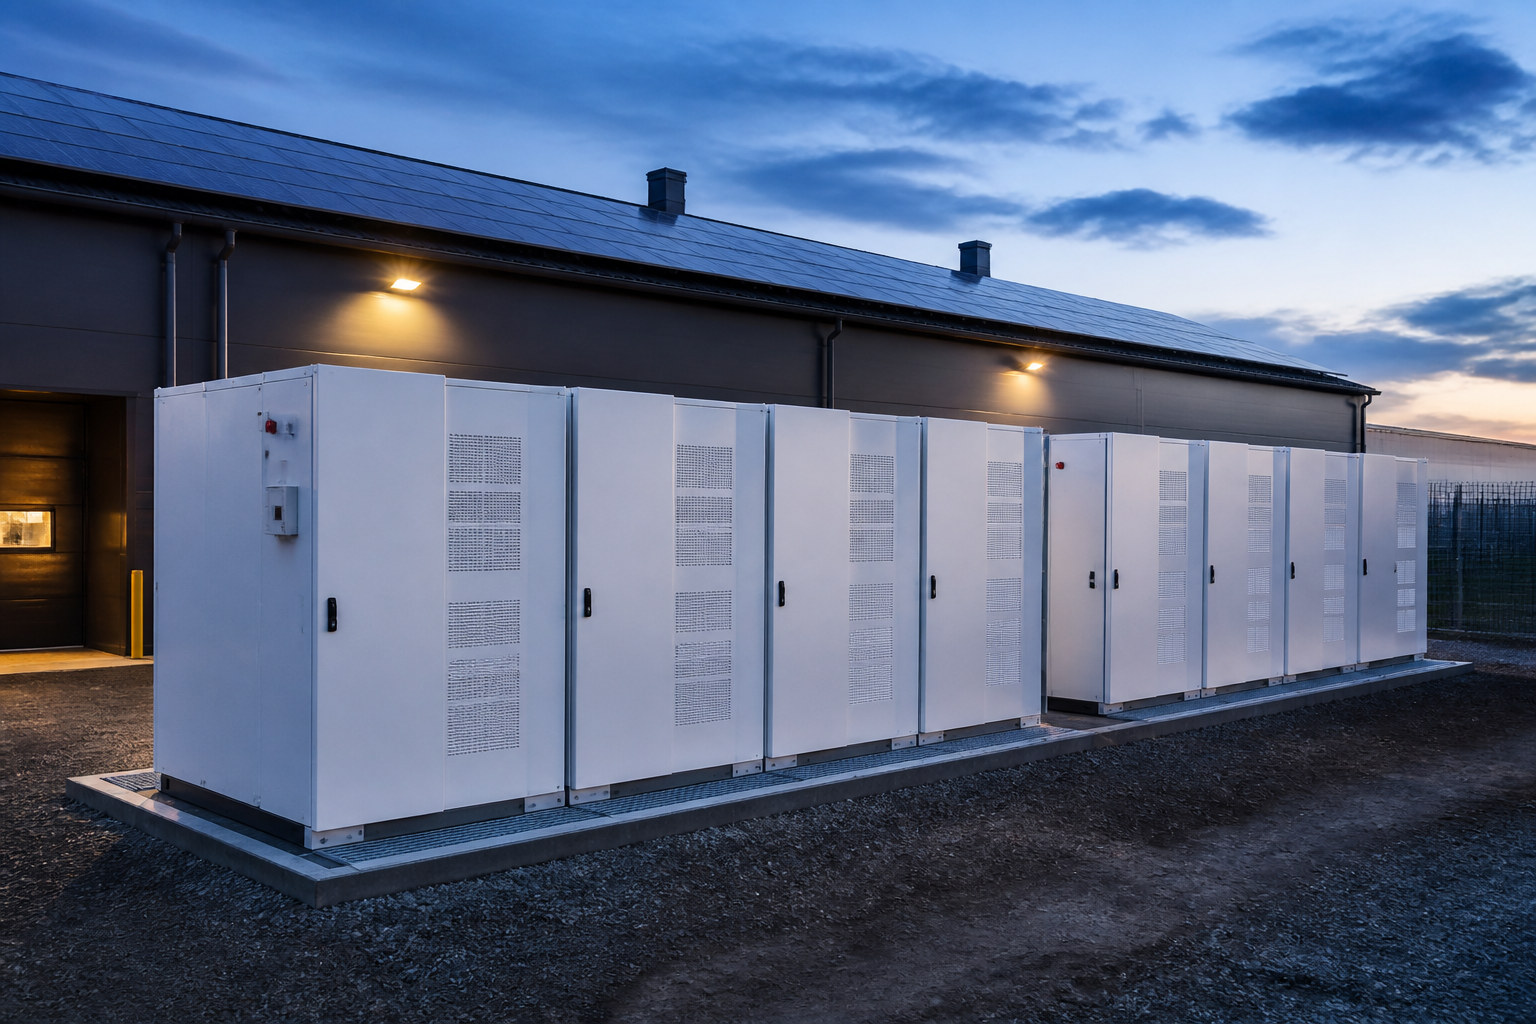

Integrated lithium battery energy storage solutions
EMS and Digital Control Bitmap

CORE TECHNOLOGIES

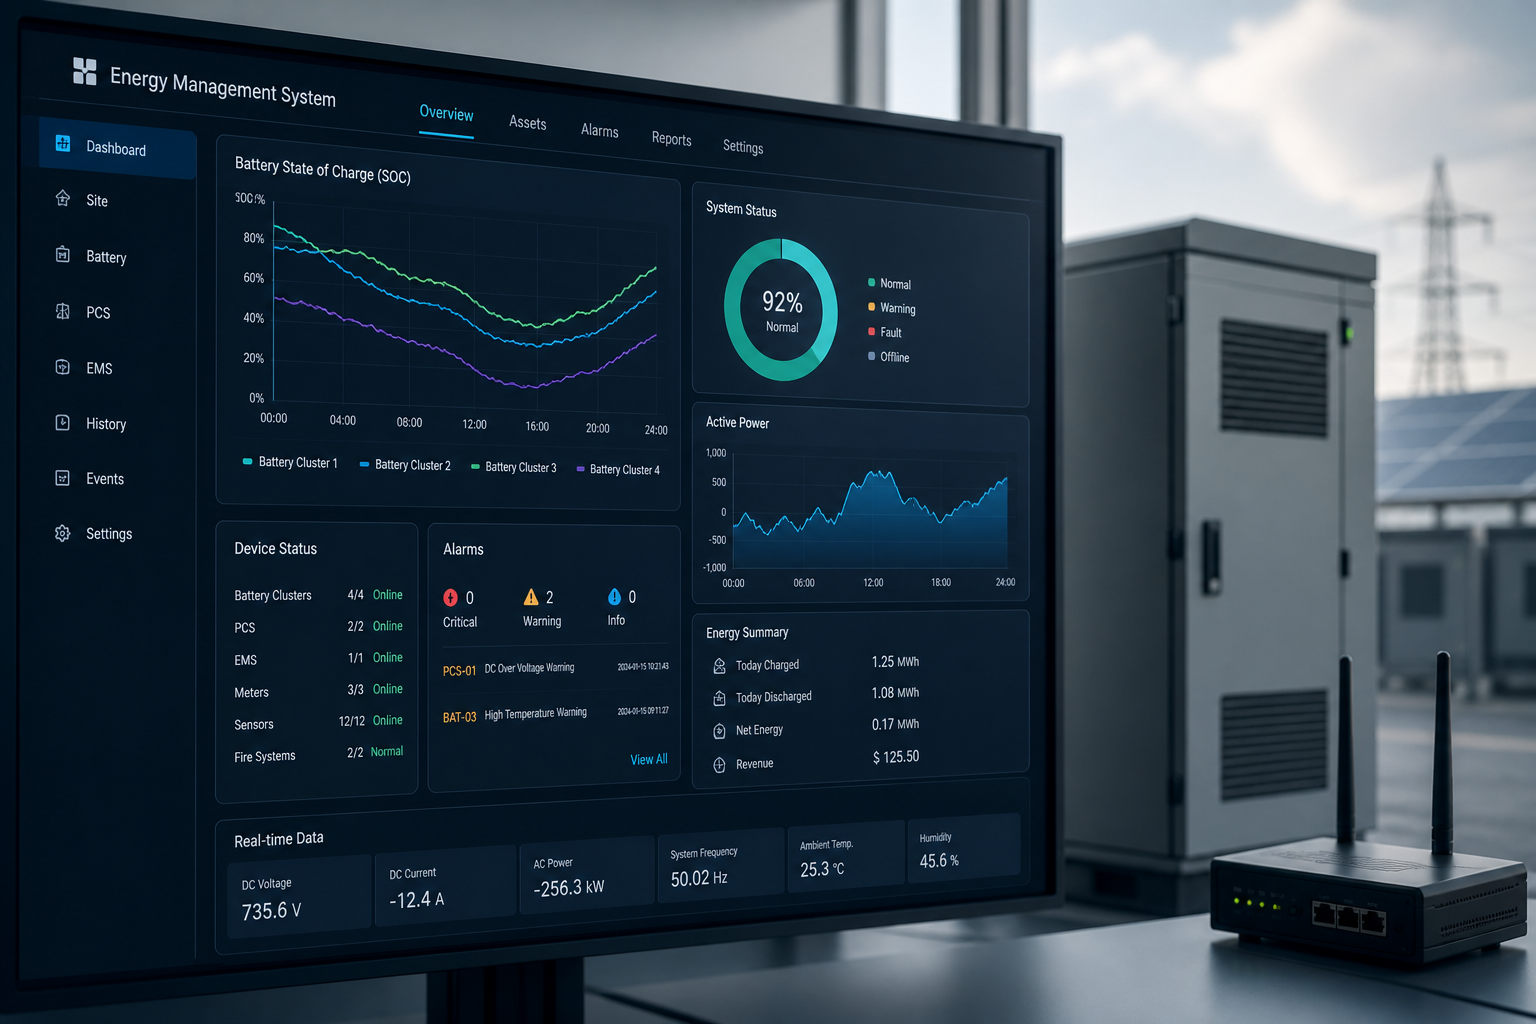
EMS digital control

EMS and edge control form a closed loop for digital operation and asset management.

EMS & Digital Control

From data sensing to real-time dispatch,
Make every resource of energy manageable, traceable.

Through close-ring control through EMS, edge controllers and equipment layers, the asset status, current projections, real-time prices, power plans, equipment constraints and unusual events are integrated into the movement, enabling storage to move from "visible" to "controlled, optimized, verifiable."

Accur
Higher returns Increase arbitrage and movement earnings
Use
More Available 98% + Availability
Safe
More secure. Multiple layers of protection and redundancy
Yu
Better luck. Predictive health maintenance
Set
It's easier to integrate. Open interface and standardization

24-hour continuous smart schedule

00:00 03:00 06:00 09:00 12:00 15:00 18:00 21:00 24:00
Current projections and plans Forecasting electricity prices, loads and new energy sources, generating full-time power programs.
Scroll corrections in the day A rolling update of the plan based on the latest resource, price and load deviation.
Real-time power allocation and feedback Second responder state, assigns power commands to the available device.

Physical assets and data sources Real and tangible.

Light Optical Array 1.25 MWp
Network Network transformer 10kV
Storage Energy Storage Systems 2.15 MWh
PCS PCS Installer 1.0 MW
Table Scale / Level Measurement
Env Environmental / meteorological sensors

Forecast input and uncertainty

Photovoltage prediction Inter-sectional error > 12%
Load forecast Inter-sectional error > 10%
Electricity price projections Inter-sectional error > 10%
Storage service requirements Real-time dispatch requirements
Projections Previous value [v] Update Time Trust interval
Photovolt 1.25 MWp 09:30 0.95–1.55 MW
Load 1.80 MW 19:00 1.62–1.98 MW
Electricity $ 0.98/kWh 20:00 $ 0.83-1.13
Modifiable Capacity 1.02 MW 18:00 0.85–1.10 MW

Optimizing objectives

1 Maximizing benefits
2 Peak shaving / valley filling
3 Demand response
4 New energy.
5 Battery lifetime optimization

Conditions of restraint Model binding guarantees

Power constraints -1.0 ~ +1.0 MW
SOC binding 10% ~ 90%
Temperature constraints Tcell < 55°C
PCS Constraints Scale efficiency and power boundary
Network constraints Power factor / Networking capacity
Storage services Available capacity / Response speed

Project Configuration Example:

Photovoltage 1.25 MWp
PCS Capacity 1.0 MW
Grid-connection voltage 10 kV
Time of shipment 2024-11
Run Mode Auto/network

24-hour plan and actual response Example Day

Daily income $12,680
Peak-valley arbitrage 2.86 USD/kWh
Cycle efficiency 0.74
Average SOC 57%
Availability of equipment 98.6%
Unusual events 2

Platform to site: close-ring control from EMS to device

Side Edge controller Local Schedule/ Protect
BMS BMS Battery management system
PCS PCS Power Change
Match Electrical distribution equipment Switch / meter
Fire Fire/ support Thermal Management / Fire
Power current Control Command Status Feedback Alarm

Border autonomy: network disruption can also work safely and smoothly

Yu Local optimization and scheduling
Paul. On-site security control
Plan Offline strategy execution
Save Local Data Cache

Local autonomous running time lines

Time Events Status Policy
11:22 Decline in the quality of communications Online Data drop sample
11:22–13:45 Cloud connection interrupted Local autonomy Continue strategy
13:46 Network Restoration Sync Batch Upload Data

Discretion closed loop A real deal.

1 Organisation Temperature trend abnormal.
2 Call it in. EMS/ Edge
3 Policy adjustments Lower power.
4 Isolation Disable device exit
5 Recovery Operation is back to normal.
6 Event Archive Generate evidence packages
Impact duration 4 minutes 33 seconds.
Maximum temperature +8.6°C
Energy Impact -0.08 MWh
Production impact No stoppage
Event Level Level 3 alert.

Asset Panorama: Regional Sites Zoom Boxes Zone Batteries

Regional level

Station level

Site Name China Industrial Storage Station
Installation 2.15 MWh / 1.0 MW
Availability 98.6%
Today Earnings $12,680
SOC 57%

cabinet level

Equipment #03
Capacity 537.5 kWh
SOC 58%
SOH 95.1%
Temperature 31.2°C

Cluster / Battery Package

Electricity 768.2 V
Electricity -132.4 A
Temperature 30.1°C
Balance &Normal
Fault 0
Insulation &Normal

Policy Rewind: Run-to-run comparisons

Indicators Traditional strategy Optimizing policy Raise
Daily income 9,150 12,680 +38.6%
Average electricity cost 2.21 2.86 +29.4%
Storage Availability Rate 82% 94% +12pp
Peak Reduction 61% 83% +22pp
Availability 96.7% 98.6% +1.9pp
08:55 Low-cost charge starts.
16:10 The peak discharge is activated.
18:35 FM resource inputs
20:05 Policy Switch
22:30 Low-cost supplement

KPI and Evidence Report

Core KPI

Availability 98.4%
Response Time P90 38 ms
Mean temperature differential 6.2°C
Proceeds 382,650
Battery health 96.420%

Auto Generate Report

Day Run the daily newspaper
Week Operation Weekly
Month Monthly reports
Yes. Incident report
V Transport report

Open connectivity: standard interface, easy integration

Time data API
Historical Data API
Control Command API
API
Policy down API
Device Model API
Asset management API
Report Interface API
IEC 61850 Modbus TCP IEC 104 CAN OPC UA

Security and compliance: multi-layered, credible and manageable

Cloud
Clouds are safe. Identification, permission management, data encryption
Side
Edge is safe. Local protection, access control, security audit
Set
Security of equipment Solid signature, security startup, loophole management
Enterprise network ↕ DMZ Area ↕ Station / Device