

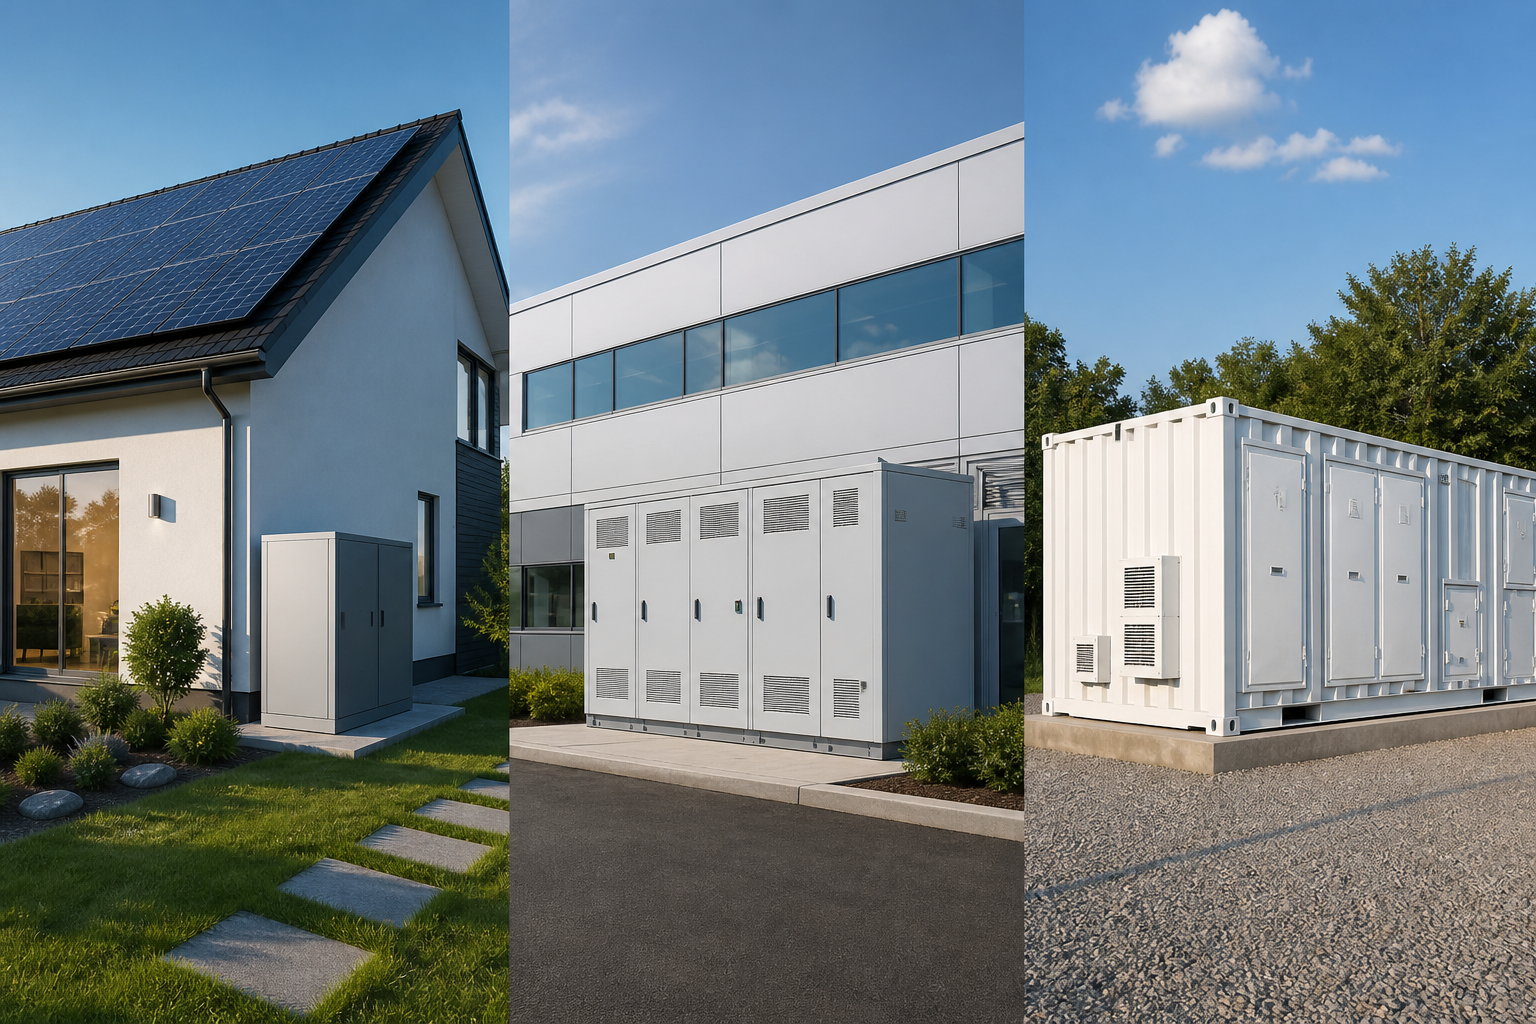






Commercial & Industrial Energy Storage
Let the reserves follow the pace of business, lower peaks and retain critical power.
Based on business plans and load targets, demand control, arbitrage, photovoltaic and critical load security are integrated into the movement control, while reducing the cost of energy utilization while retaining the necessary emergency capacity and operational flexibility.
Yes
Demand peak-shaving control
Following changes in operating loads, proactively control peak requirements.
Price
Optimization of the cost of electricity
Low-charge high-allocation and arbitrage in conjunction with the price of electricity in Peak Valley.
Paul.
Critical load security
Retain emergency SOC and back-up power to balance reliability.
Sector
Multi-user and campus extensions
Support for multi-building, multi-counting and multi-energy units.
Electrical integration and energy flow
EMS Energy controller
Building load
HVAC / Light
HVAC / Light
Production load
Device / Elevator
Device / Elevator
Critical load
IT / Fire / Security
IT / Fire / Security
Repository movement driven by business week Example:
| Business status | Monday. | Tuesday | Wednesday | Thursday | Friday | Saturday | Sunday |
|---|---|---|---|---|---|---|---|
| Office building occupancy | |||||||
| Shops are open | |||||||
| Ventilation and air conditioning | |||||||
| Storage operations | |||||||
| Special activities |
Projected requirements
Power determines the ability to peak, energy determines the duration.
Power (kW)
To decide on the possibility of pressing the load at short notice below the target requirement at peak times.
Energy (kwh)
Determine how long it can last and how much emergency capacity needs to be retained.
Load and electricity characterization Example:
Maximum monthly requirement
Maximum requirements for the month 1,256 kW
Maximum requirement last month 1,281 kW
Electricity price structure (TOU)
| Period | Time | Electricity |
|---|---|---|
| Peak | 11:00–14:00 | 1.298 |
| Peak | 14:00–17:00 | 1.068 |
| Square | 17:00–22:00 | 0.688 |
| Low Valley | 23:00–07:00 | 0.368 |
Photovoltaic power generation
Electricity generation 1,842 kWh
Peak 412 kW
Percentage of sub-needs
Office building 500 432 39.8%
Retail B 300 276 25.4%
Storage C 250 214 19.7%
Device D 250 146 15.1%
Power factor and failure
PF 0.95
No merit 102 kvar
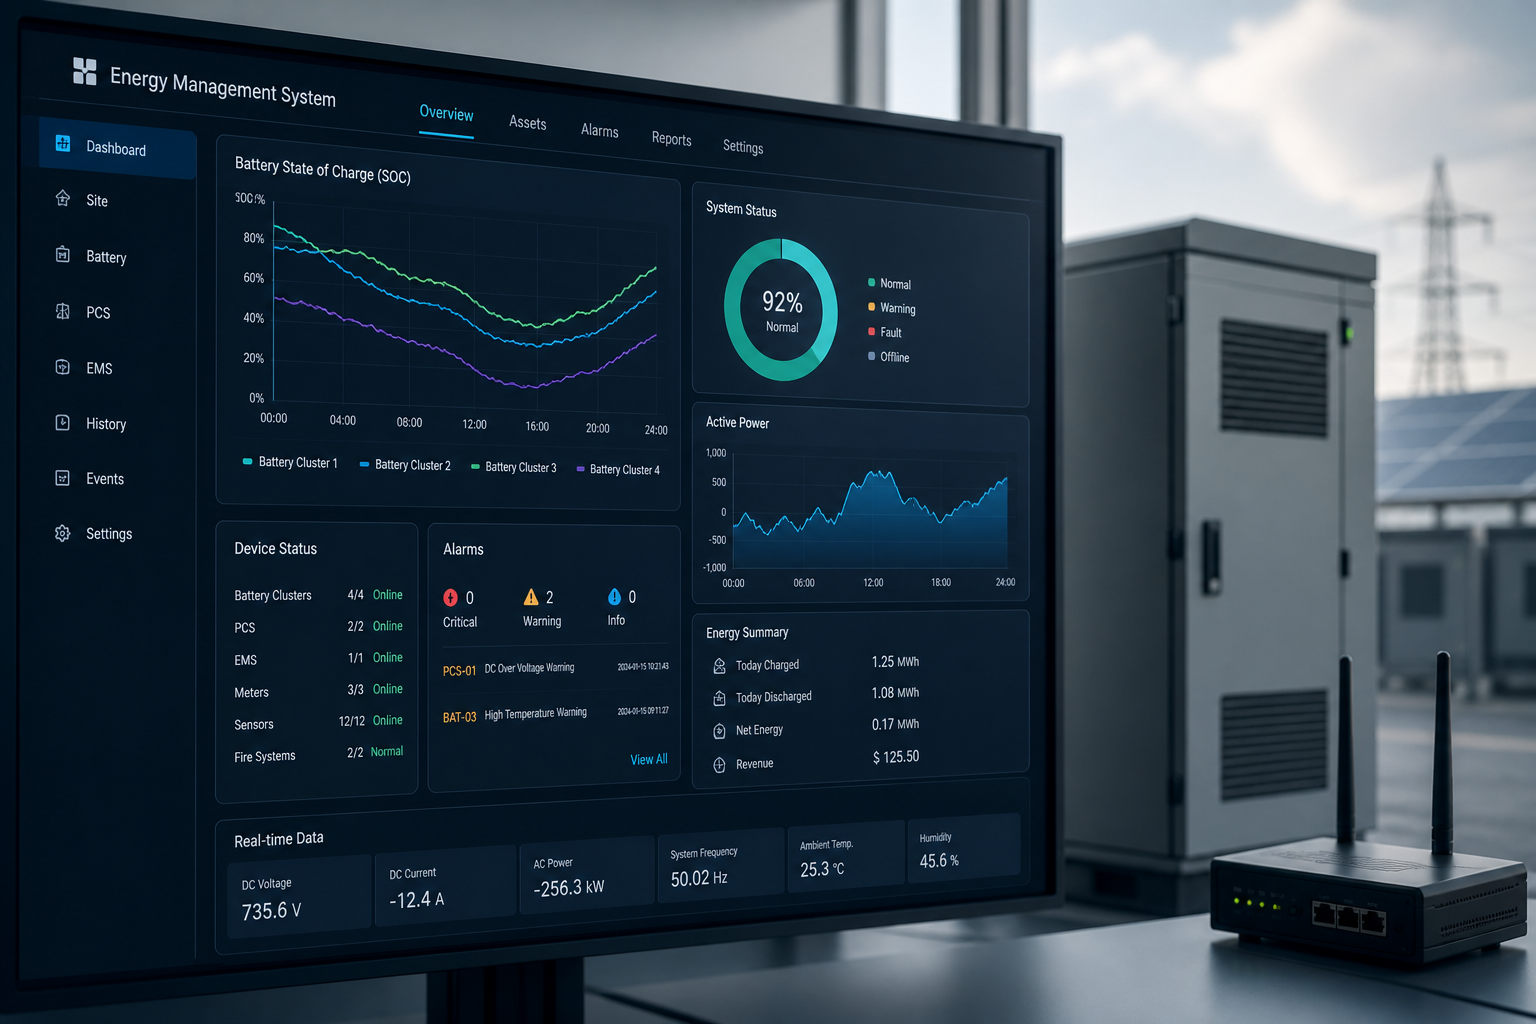
Energy Storage Systems State
SOC 72%
Power 164 kW
Electricity 764 V
Temperature 28.6 °C
Status Running
Four-value paths, one map to make a decision.
1 15 minutes to control.
Application: commercial parks with requirements close to contract ceilings
2 Peak Valley electricity price optimization
Application: Price differentials are significant and load patterns are stable
3 Photovoltaic Absorption
Application: Large light-voltage, self-use requirements High
4 Critical load protection
Application: Optical or storage capacity to cover back-up needs at the same time
Key decision-making variables in the integrated plan
Yes Required Quantification Target / contract /
Price Electricity price constraints Peak / Peak / Flat / Valley
Ji. Storage constraints SOC/ Power/ Cycle Number
Paul. Critical load constraints Minimum guaranteed capacity / backup time
Light Optical limit Projected contribution / spontaneous self-use
Target requirement control Example:
Prior to projection
After projections
Control parameters
Target requirements 1,100 kW
SOC Reservations 30%
Maximum discharge 250 kW
Duration 60 min
Energy efficiency and operational indicators
The Peaking Event 28 times
Peak Reduction 97.6%
SOC Minimum 31%
Power Consistency ±1.0%
Critical load boundaries and retention strategies
Precedence retained
- Security system / Fire system
- Server / Network Device
- Critical production equipment
- Emergency lighting
- Elevator and evacuation systems
Flexible dispatch
HVAC / Colder System General office load EV Charge Area Landscape lighting Non-core tenant load
ATS / Storage and Critical Load
Grid Connection Status
ATS
Critical load
Normal load
Energy
Retain Policy
Min SOC 30%
Maximum discharge power 250 kW
Standby time ≥2.0 h
Restore Window 60 min
When business plans change, the dispatch strategy has to be recalculated.
1 Inspection of incidents
Business plan changes, weather changes, temporary activities, increased critical load.
2. Load and photovoltaic prediction
Recalculates future loads, PV output and corresponding risk windows.
3 Optimization and binding generation
New plan for combined electricity prices, SOC, requirements and spare capacity generation.
4 · Dispatch execution
Release PCS charge power and regional targets.
5. Validation and duplication
Continuous calibration and recording of peaks, earnings and SOC changes.
Basis for binding: Target Demand Curve / Electricity Structure / SOC Boundary / Cost and Benefit Assessment
Site engineering design and layout
1
2
3
4
| Device Space | ≥1.5 m |
|---|---|
| Fire access route | ≥4.0 m |
| Maintain channel | ≥1.5 m |
| Isolation distance | By norm |
| Ingress protection | IP54 / Outdoor |
| Extension | Support modularization expansion |
Multi-construction extension and measurement boundary
Single construction
Single title / Single meter
→
Shared commercial courtrooms
Public distribution/sharing measures
→
Multi-storey campus.
Multi-tenant/ Partition Measurement
Measurement and validation M&V
Measuring links
Baseline and measured data
| Indicators | Baseline | Actual | Change |
|---|---|---|---|
| Maximum requirement | 612,540 | 590,112 | -14,428 |
| Electricity cost | 412,360 | 388,790 | -23,570 |
| Peak Valley Difference | 321,760 | 300,120 | -21,640 |
Monthly control indicators
The Peaking Event 28 times
Trigger success rate 97.6%
SOC Minimum 31%
Control consistency ±1.0%
Validate conclusion
✓ Authentication status: qualified
Capacity for full life cycle delivery
research Field research Load and electricity analysis
Yeah. Capacity measurement Power / Energy Match
Set System design Electrical and control design
Set Device integration PCS / BESS / EMS
Measure Joint inspection and inspection FAT / SAT / M&V
Transport Operational monitoring Peak / SOC / Proceeds
Yu Continuous optimization Policy & Arguments
NEXT STEP
Combining Boundaries and Delivery Paths around Commercial & Industrial Energy
Programme configuration and implementation tempo can be further confirmed on the basis of on-site loads, netting conditions, installed space and transportation requirements.