



Off-grid & Remote Power
Without a stable electricity grid, predictable and sustainable energy systems can be established
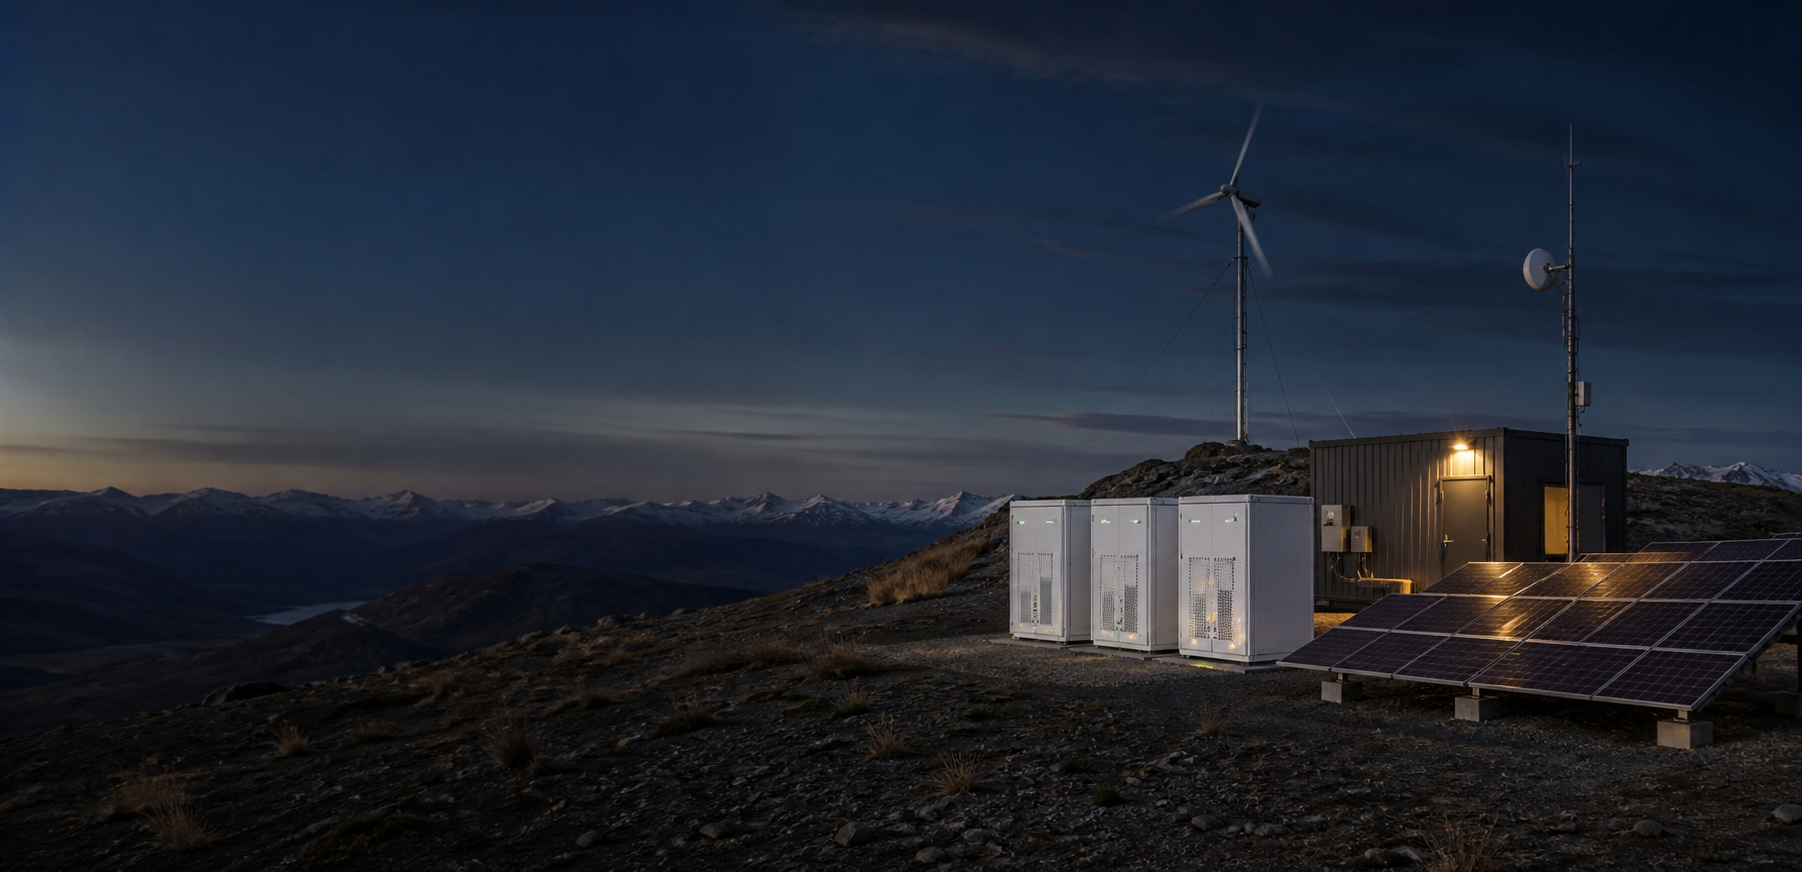
Resource-based, load-driven and energy-reserve-core buffers, which integrate photovoltaic, wind, energy storage, back-up power and communication systems to create sustainable, remote-maintenance, scalable and autonomous Microgrid in a weak or wireless environment.
Local energy autonomy
Photovoltaic, wind, storage and back-up power mix operated.
Resource uncertainty management
Energy movement is implemented at forecasting, SOC and load priorities.
Load Priority Management
Critical power supply, critical time periods and secondary load layer control.
Remotely maintained
Low-bandwidth communication, remote diagnosis and offline autonomy.
01 / System Popup
A solid and self-sustaining Microgrid leap.
Power generation resources, PCS, the energy core and the graded load share a controlled energy path.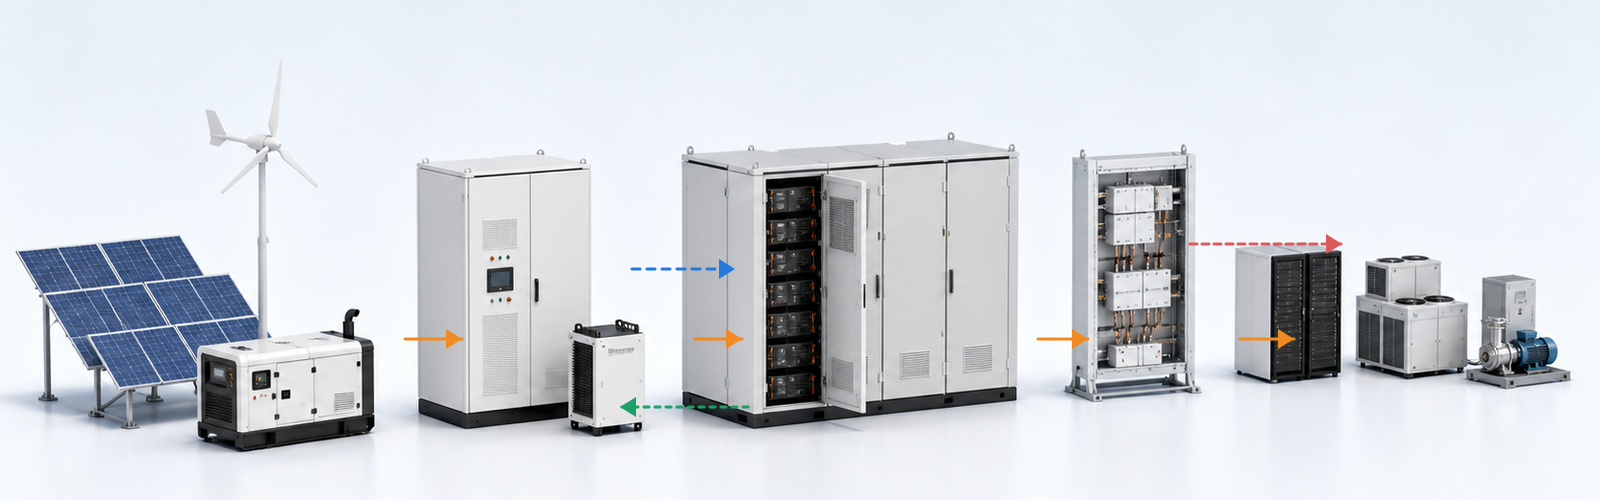
- Energy sources
- Power Change and Control
- Energy Storage Systems
- Local distribution matrix
- Load Rating
Energy systems
Power Change and Control
PCS / Mixed Reverser
Two-way power control/ off-grid switching
EMS / Station
Projection, SOC, uniform deployment of load and equipment
Protect and Link
Electrical protection / device lock / failure down
Energy Storage Systems
LiFePO4 Batteries
Available capacity 430 kWh
Available capacity 430 kWh
Local distribution and load
Key Load Communications / Medical / Surveillance / Security
Normal Load Lighting / Office / Supporting equipment
Delayable Load Pump / Heat / Non-Key Equipment
Energy Flow
Control the signal.
Status Feedback
Alert / Protect
02 / Annual Energy Desk account
Guaranteed year-round running at worst
The monthly energy supply structure, load demand, SOC bottom line and gap days enter the same account and freeze the capacity configuration. Monthly energy balance Energy (kWh/day)
Photovoltaic power generation Wind power generation Fuel generation (optional) Battery supply Energy gap Load Needs
SOC Trends Minimum protection floor 20%
100%50%0%
Resource overview (typical year)
| January | February | March | April | May | June | July | August | September | October | November | December | |
|---|---|---|---|---|---|---|---|---|---|---|---|---|
| Horizontal exposure (kWh/m2 d) | 2.2 | 5.3 | 6.1 | 6.3 | 6.0 | 5.2 | 4.3 | 4.1 | 4.8 | 2.9 | 2.1 | 2.1 |
| Wind speed 10m (m/s) | 4.1 | 4.3 | 4.6 | 4.9 | 5.2 | 5.6 | 5.5 | 5.1 | 4.1 | 3.9 | 3.8 | 3.8 |
Slide left and right to see the whole month
Gaps and security sufficiency
| January | February | March | April | May | June | July | August | September | October | November | December | |
|---|---|---|---|---|---|---|---|---|---|---|---|---|
| Energy gap days (days) | 0 | 0 | 0 | 0 | 0 | 0 | 0 | 0 | 1 | 3 | 2 | 0 |
Slide left and right to see the whole month
Worst Month October(driver configuration)
Configuration and Assumptions (demonstration values)
- Key Load
- 48 kW(24/7)
- Photovoltaic machines
- 160 kWp
- Wind sets
- 20 kW
- We can use energy.
- 430 kWh(90%)
- System Efficiency (Group)
- 86%
- Standby factor (worst months)
- 1.25
- SOC Protect Line
- 20%
- Resuscitation target (worst month)
- ≥ 24 h
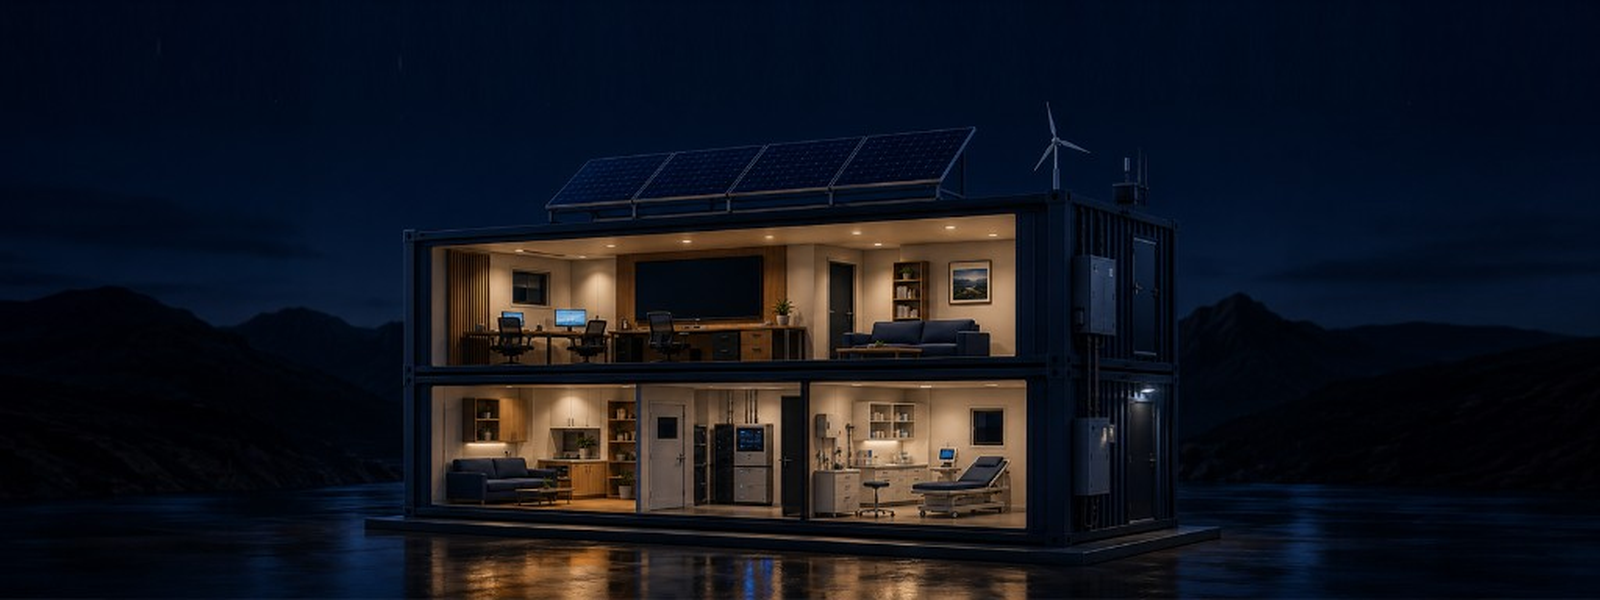
03 / Worst Work Conditions Energy Balance
Off-grid design is the worst energy balance ever.
- Communications room18 kW
- Water network system10 kW
- Refrigeration8 kW
- Lighting and life6 kW
- Medical care and emergency response6 kW
Total critical loads 48 kW
04 / Engineering fit
Different environments, same engineering logic.
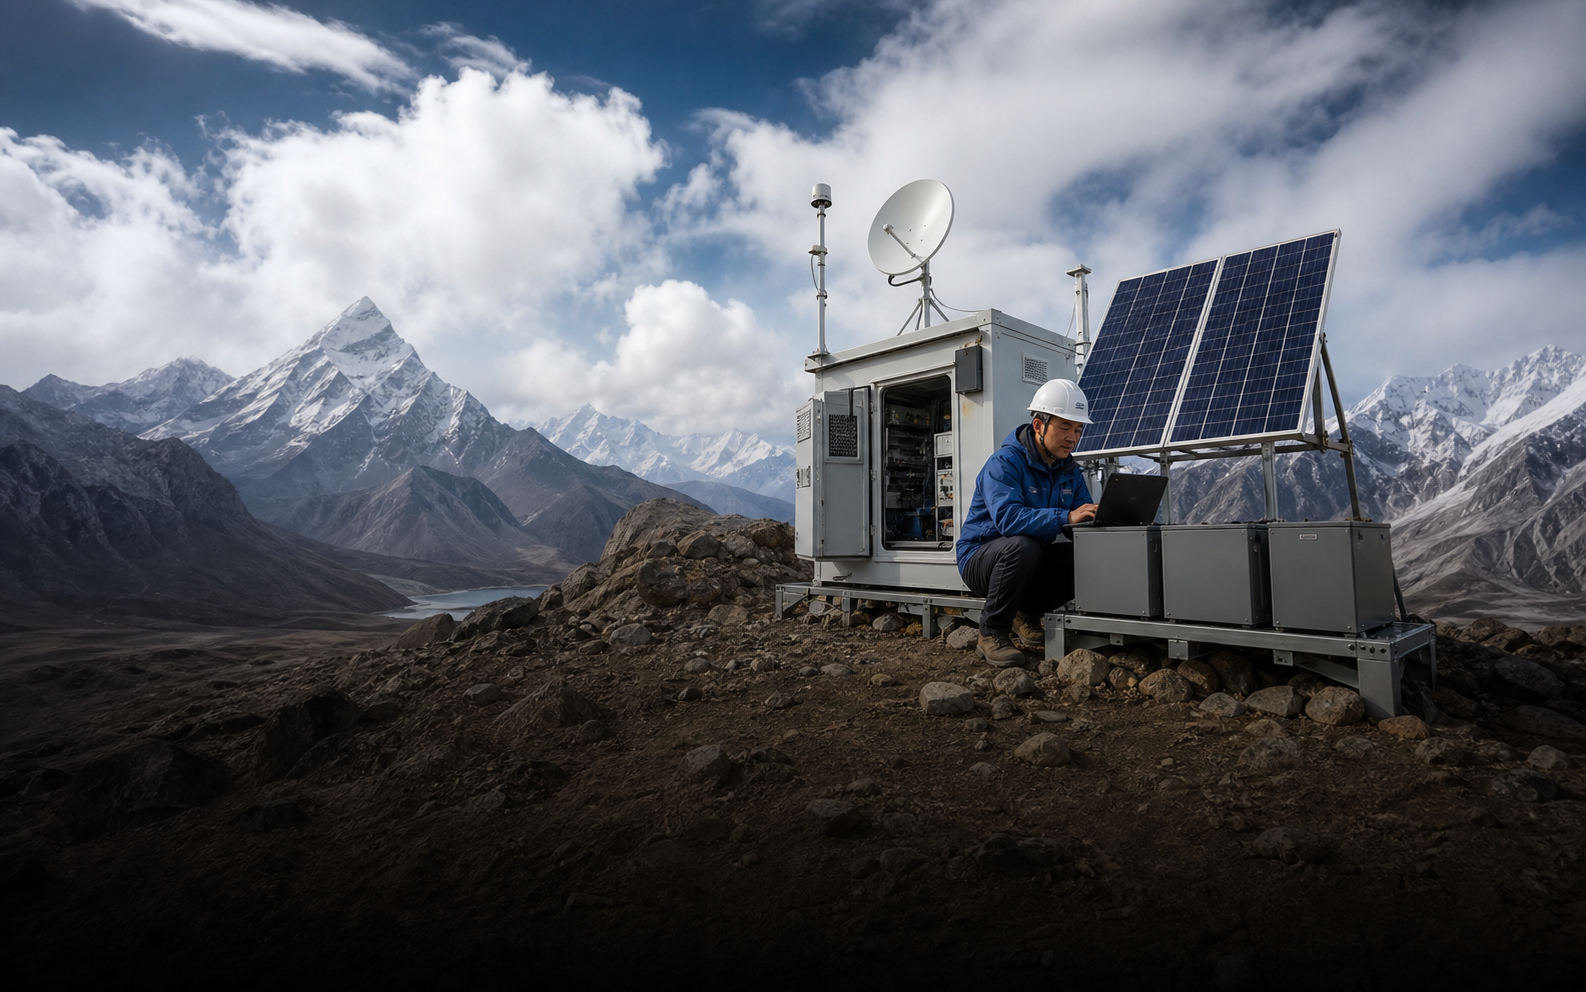
Highland communications station Temperature, strong wind, low air pressure and high altitude conditions.
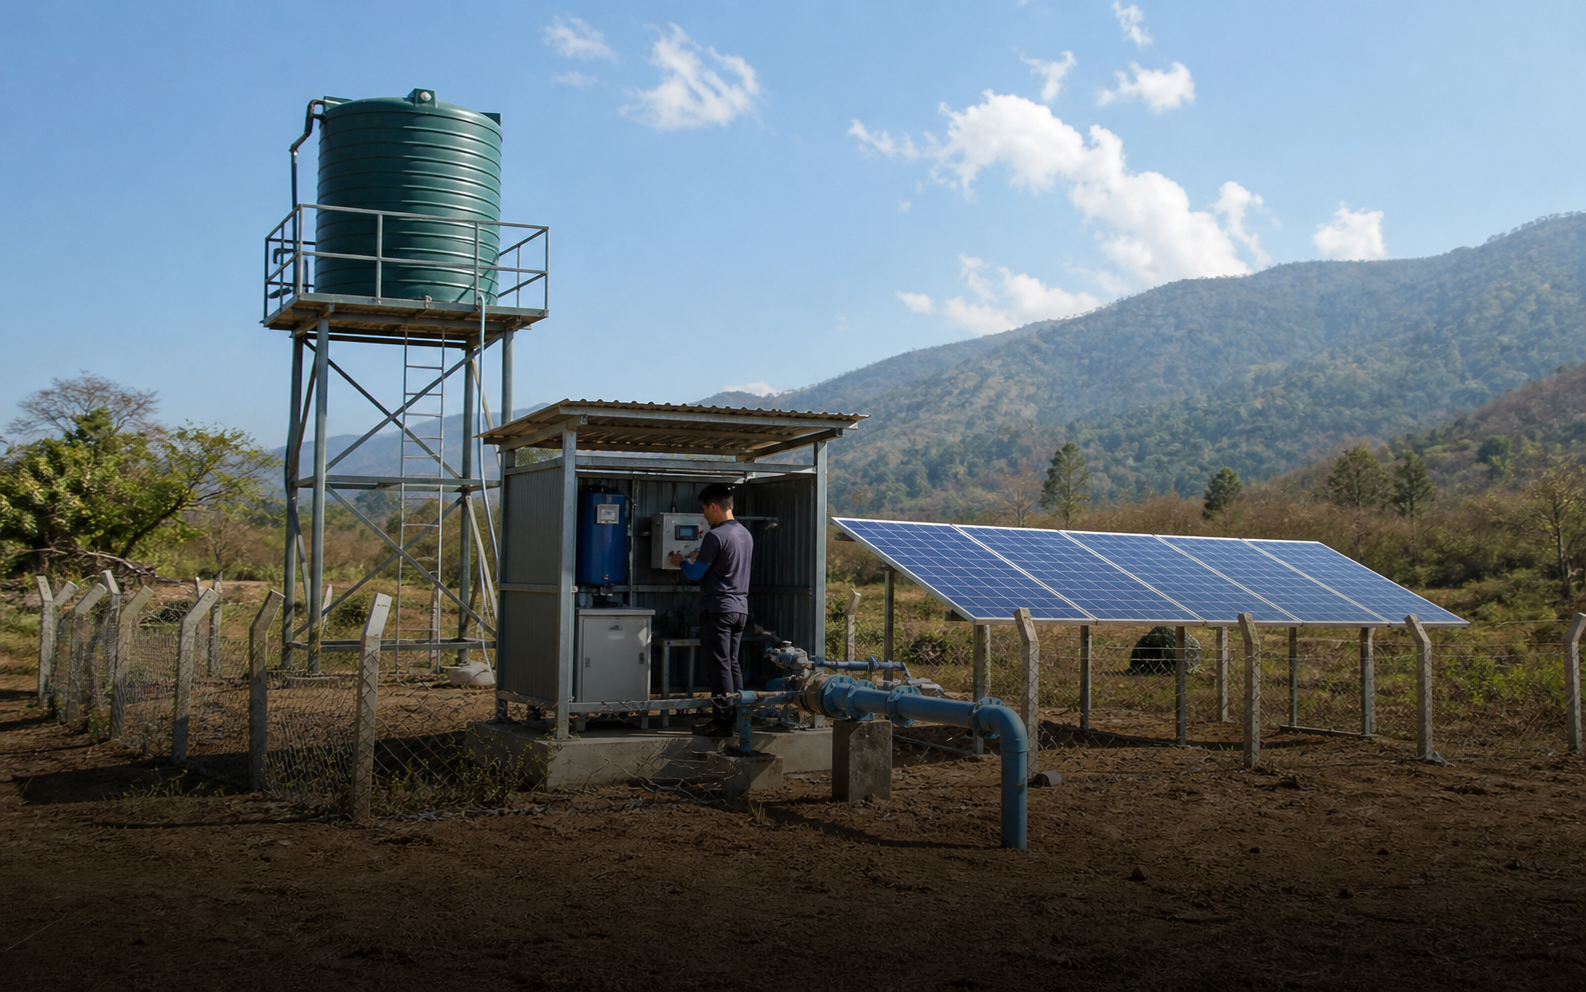
rangeland / water station Long absence and limited resources for maintenance.
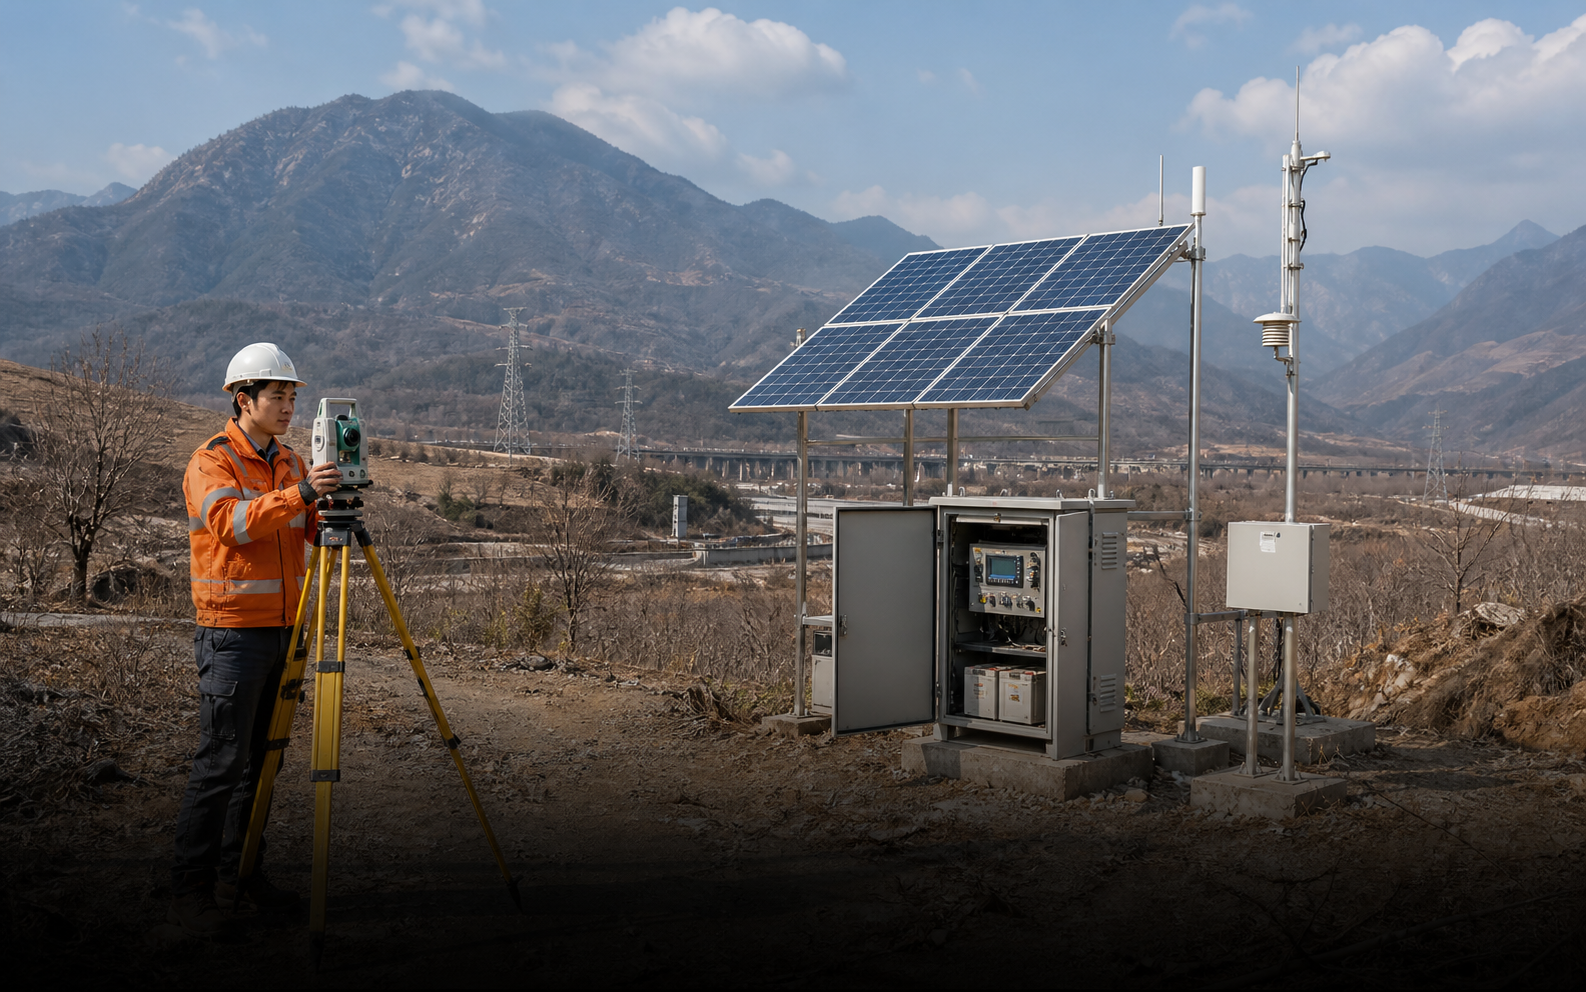
Mapping / public facilities Multiple modes of communication and decentralized load access.
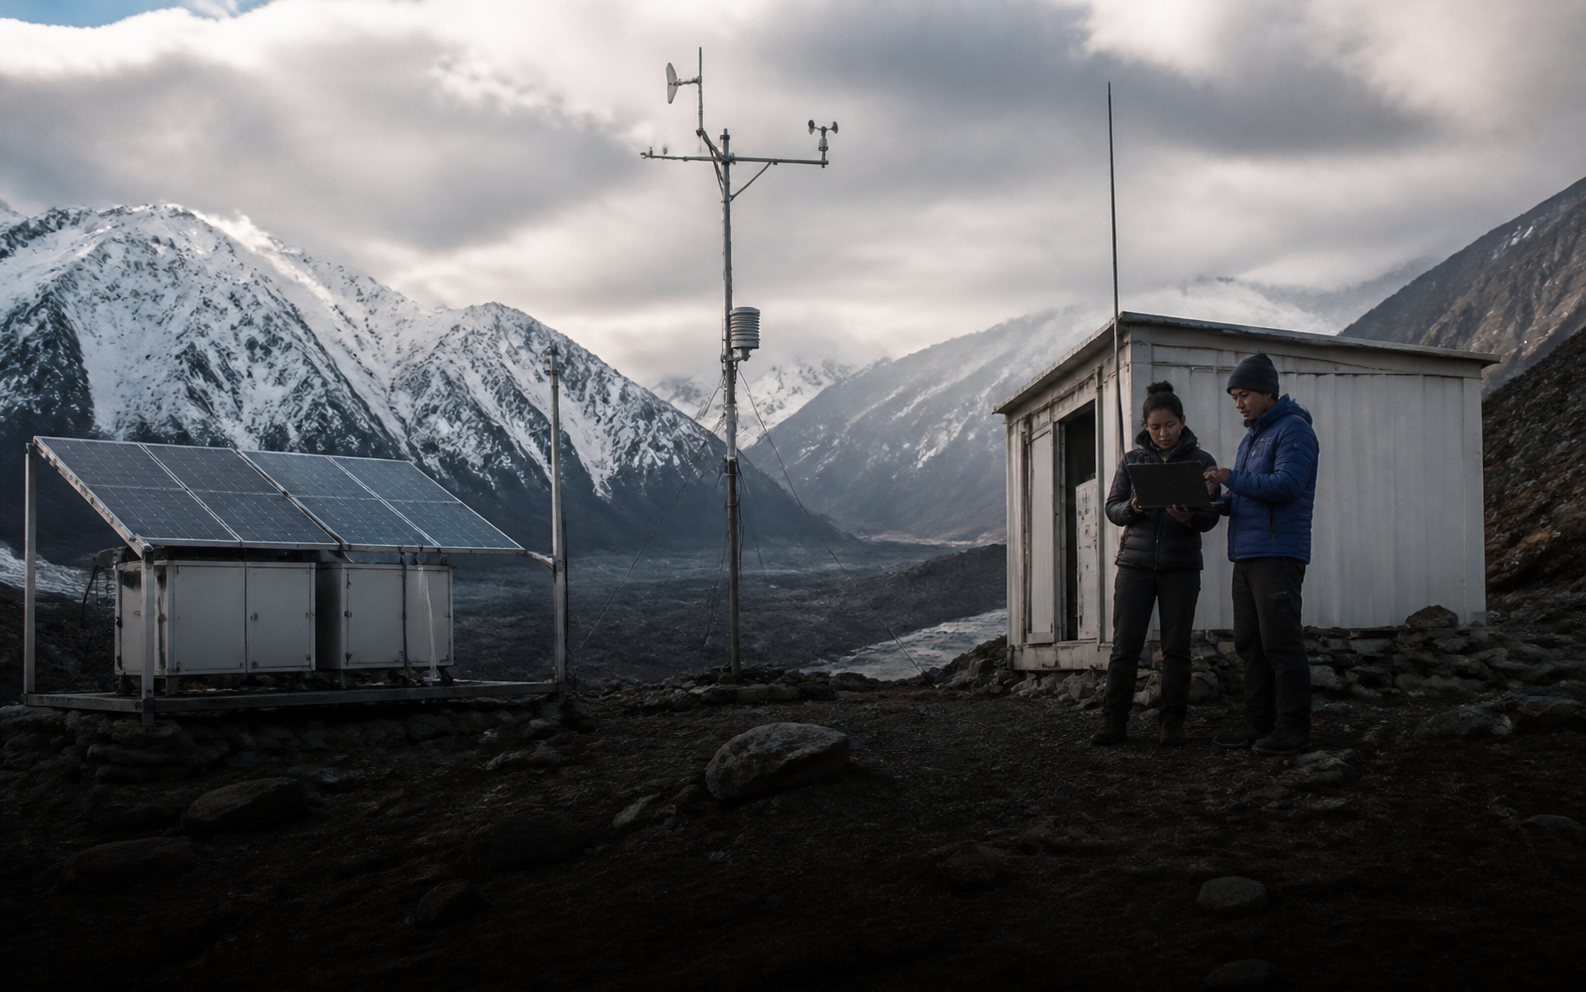
Scientific / remote sites Extreme weather and long-range supply conditions.
05 / Resources and load survey
Climate, traffic and load into the same project view

Solar energy resources
Average annual exposure 4.7 kWh/m2dPeak-dance 6.3 h/d
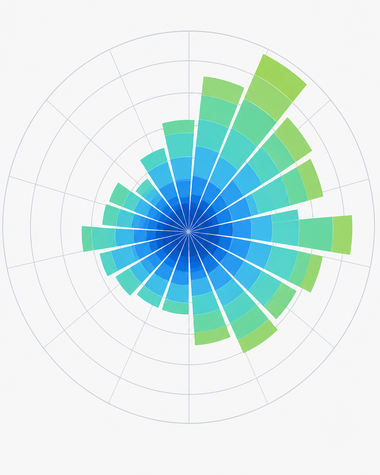
Wind energy resources
Average wind speed (10m) 4.7 m/sExtreme winds 18 m/s
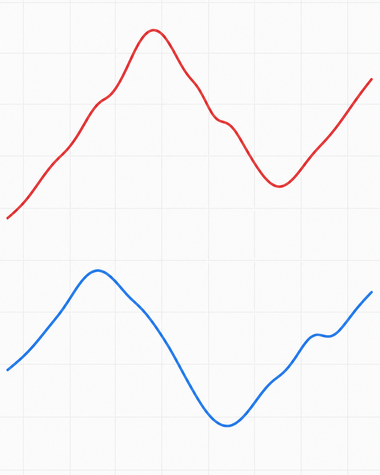
Environmental Conditions
Extremely low temperature - 22°CExtremely high temperature 28°C

Road conditions
Path to entry 4.2 km60% access.

Fuel and logistics
Fuel supply distance 80 kmResupply period 45 days

Communications environment
Satellite bandwidth 512 kbpsTime extension 680 ms
06 / Run scene simulation
Run scene emulator
- Energy Flow
- SOC
- Generators run
- Load Priority Status
- Alarm
It's raining.
Storage powered support to protect critical loads according to priority
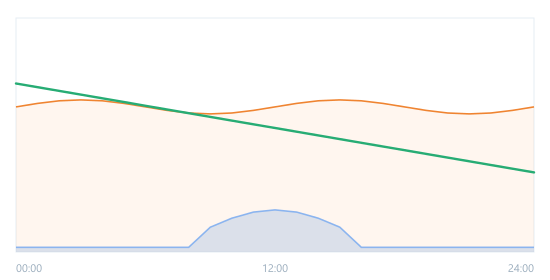
- PV
- 95 kWh
- Load
- 1,152 kWh
- SOC
- 72% → 34%
- Generators
- Standby
- Net shortfall
- −1,057 kWh
It's a long wind.
Wind and power refuelling.
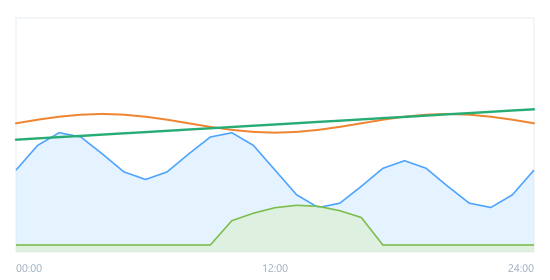
- PV
- 180 kWh
- Wind
- 860 kWh
- Load
- 1,152 kWh
- SOC
- 48% → 61%
- Generators
- Not started
Electric / High load peak
The power of the moment, the PPS, and the storage.
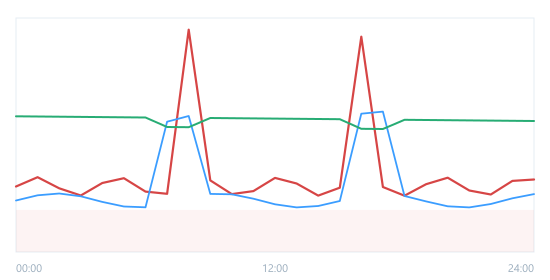
- Peak Power
- 95 kW
- Start Time
- 42 s
- Generators
- Not started
- A moment.
- Peak 34%
- PCS Synergy
- Input
Planned maintenance
Generators powered, storage charged
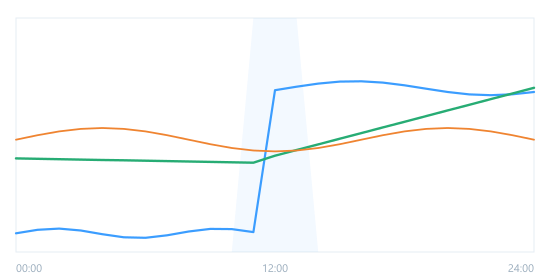
- Generator Output
- 80 kW
- Charge Power
- 25 kW
- SOC
- 40% → 70%
- Key Load
- Maintenance
- Alarm
- None
07 / Status Machine
Black Start and Decline Runner
Black Start Process
- 1 Subsistence energy sourceReserve Battery Schedule
- 2 Activate system power.BMS Start
- 3 PCS Create Local MasterFrequency / voltage stabilization
- 4 Input key loadP1 Level
- 5 Input Secondary LoadP2 Level
- 6 Input timed loadP3 Level
08 / Modularization and Extension
Modularization and scalable architecture From single to multiple stations
Modular energy systems
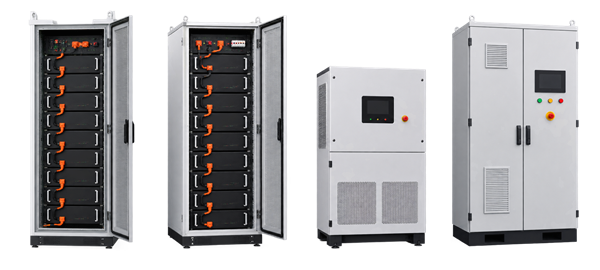
Multistop interconnection
Central
Site A
Site B
Site C
Site D
09 / Environment and logistics
Environment and logistics engineering Project detail determines reliability
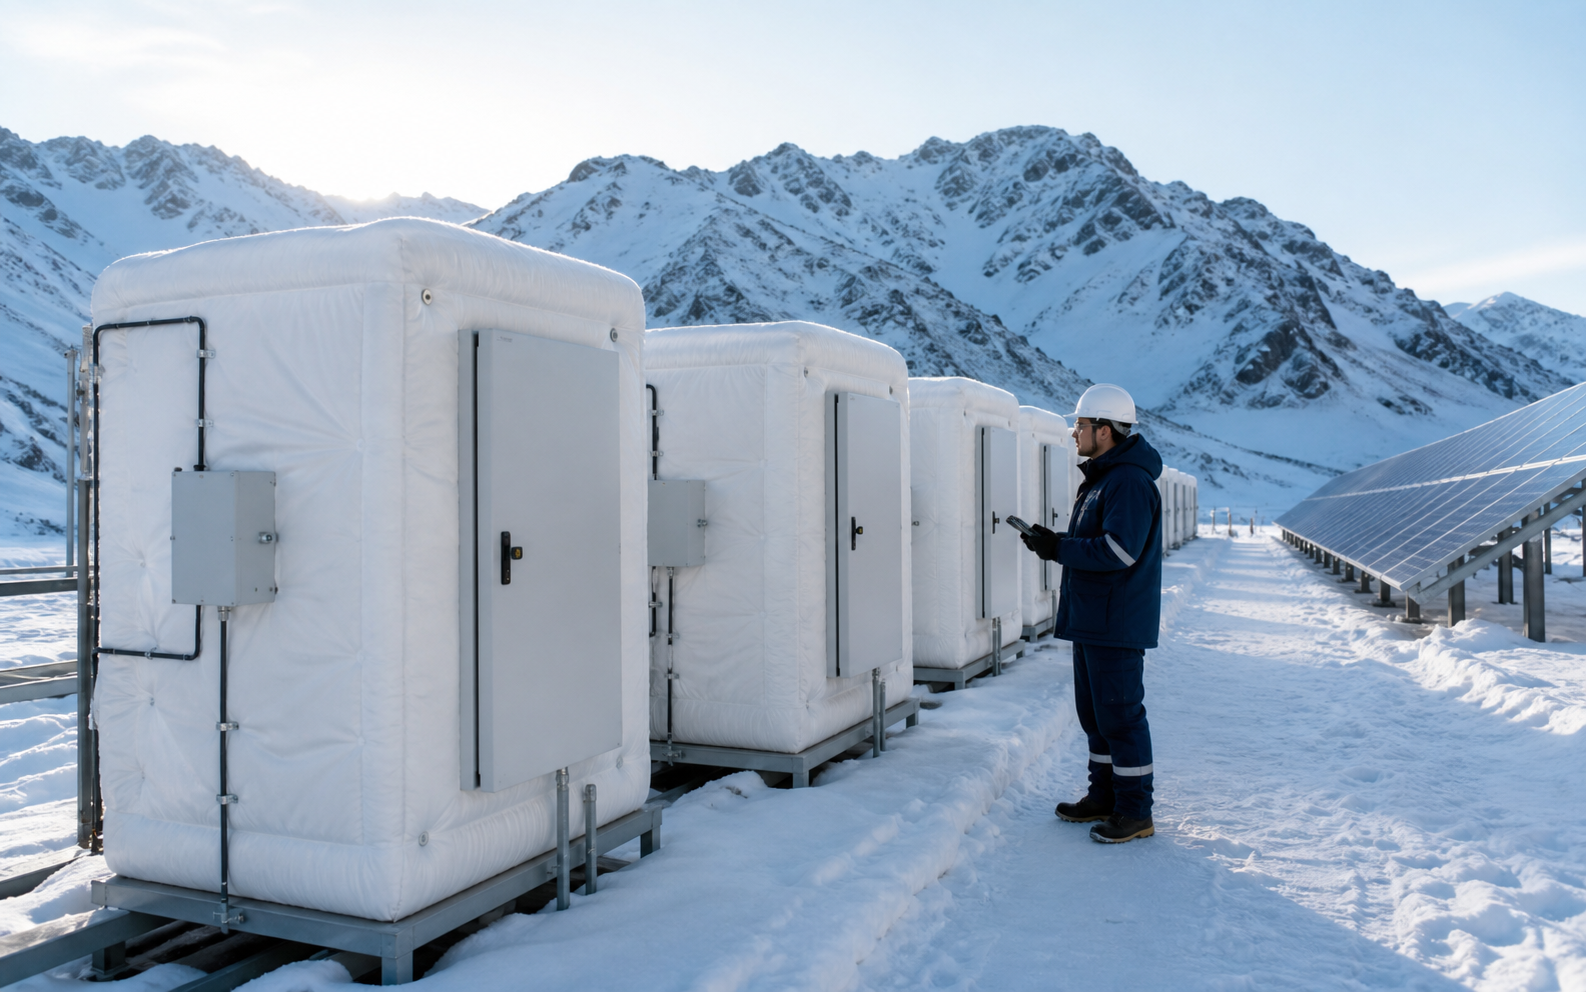
It's perfect for cold. Battery preheating, temperature protection, condensation.
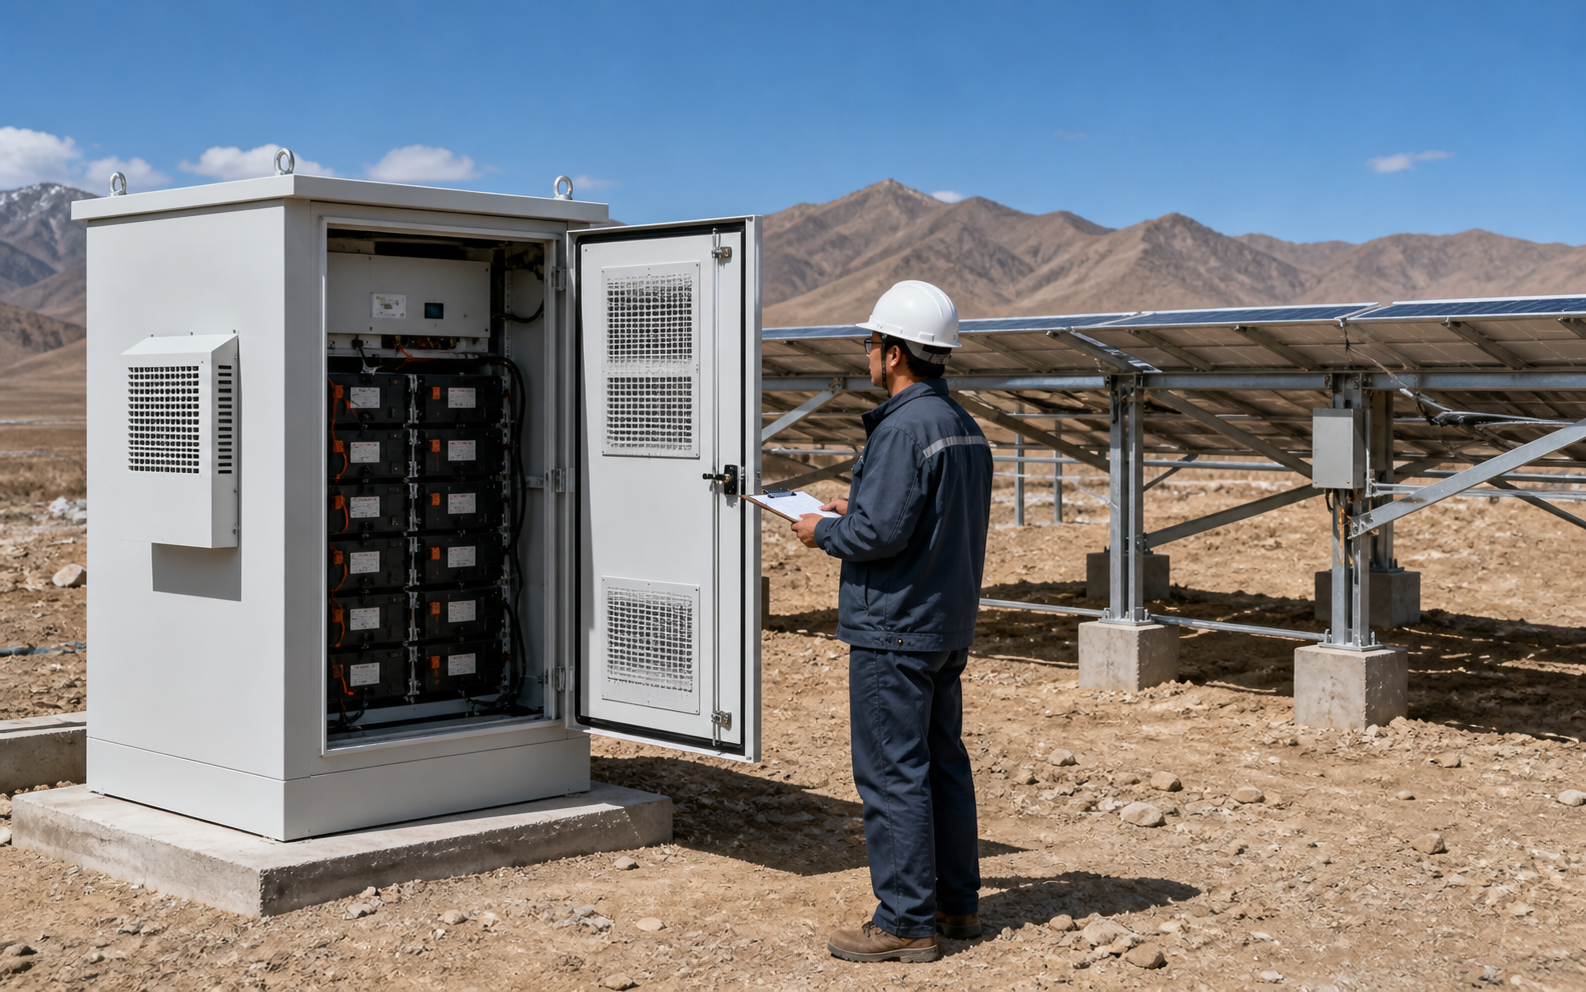
Preserve corruption and dust. High protection level and sealed structure.
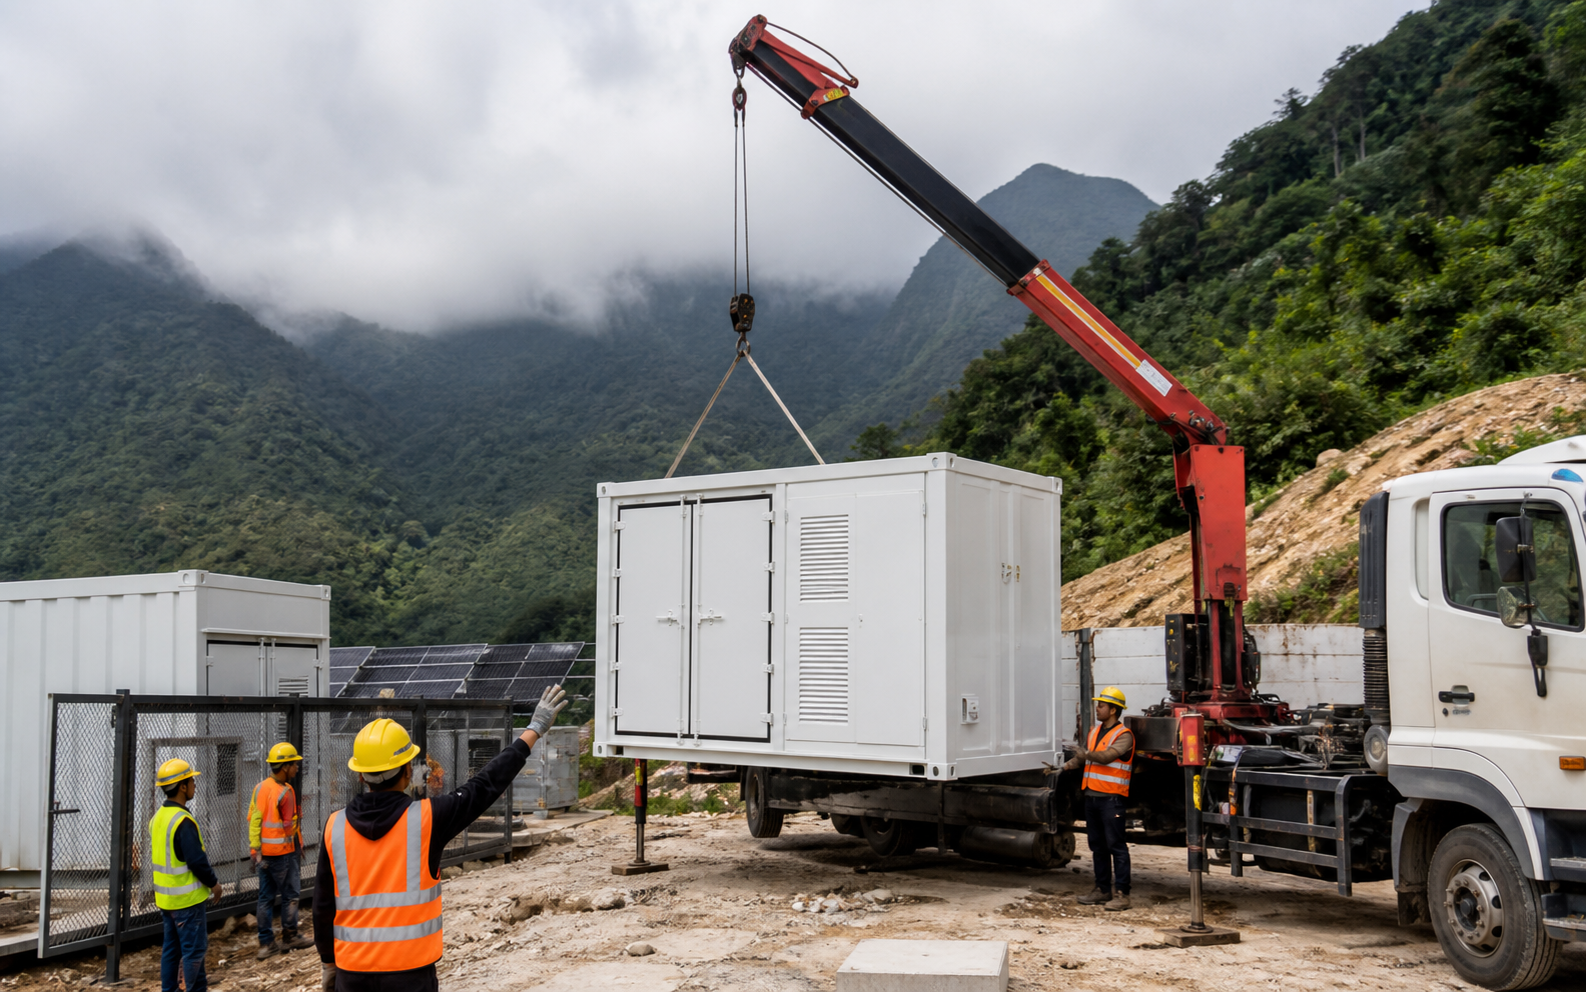
Transport and suspension Modularized transport, standard posts.

Field Base Concrete foundations and fast-track structures.
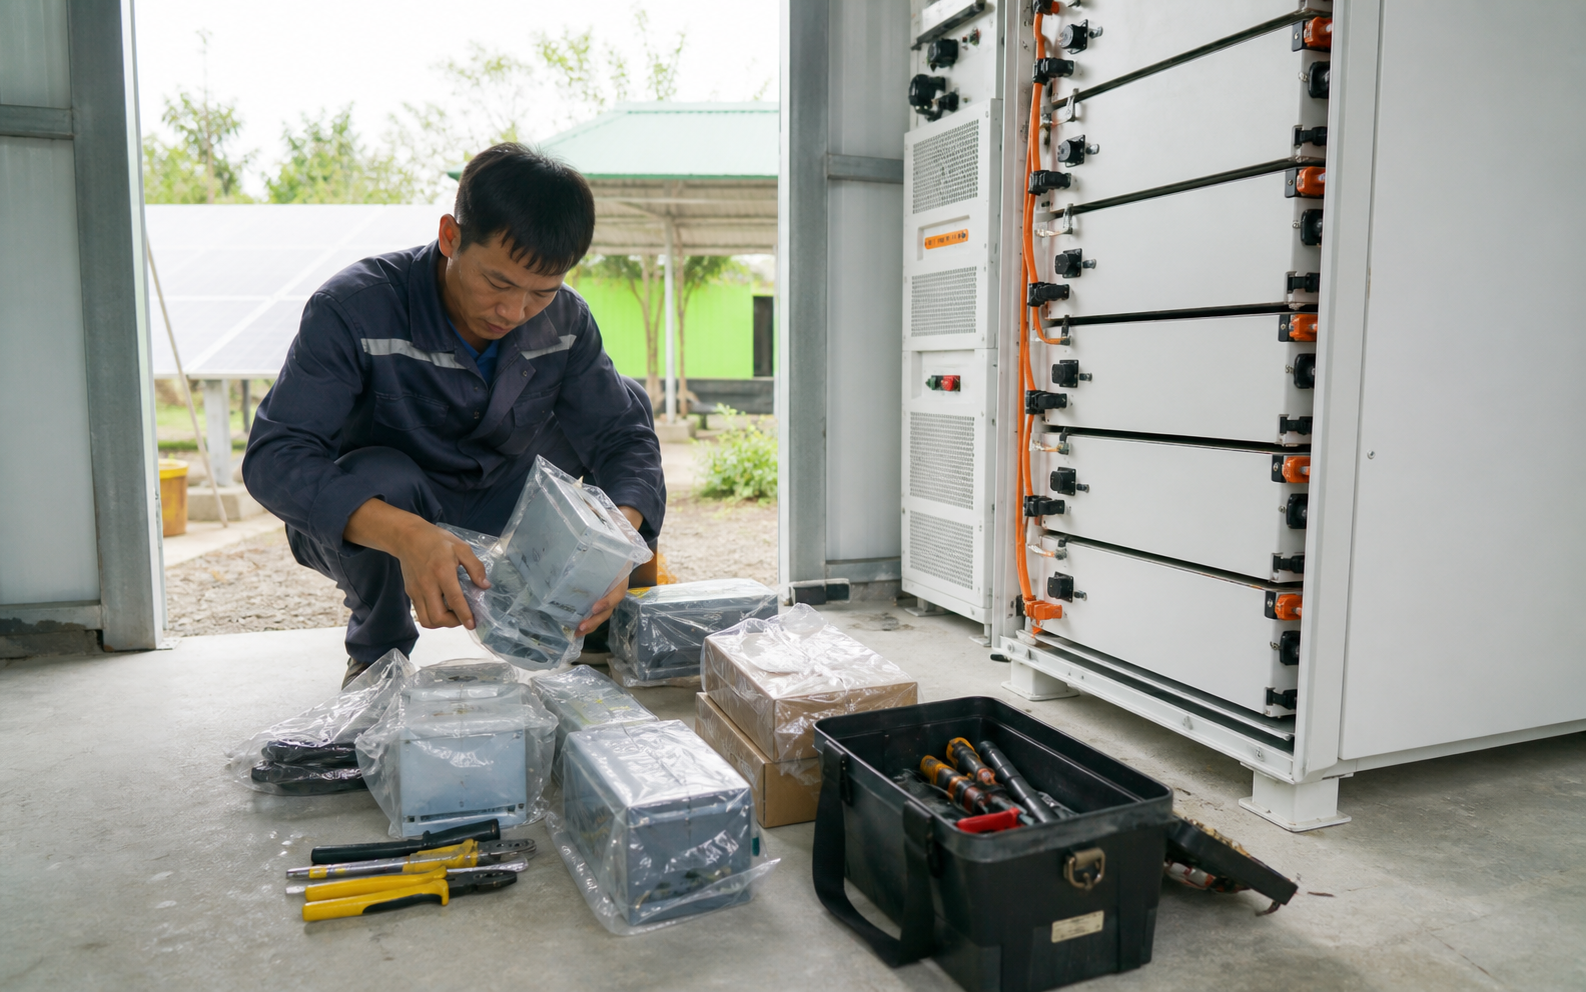
Spare parts and maintenance In situ replacement components and key spare parts.
10 / Remote O&M
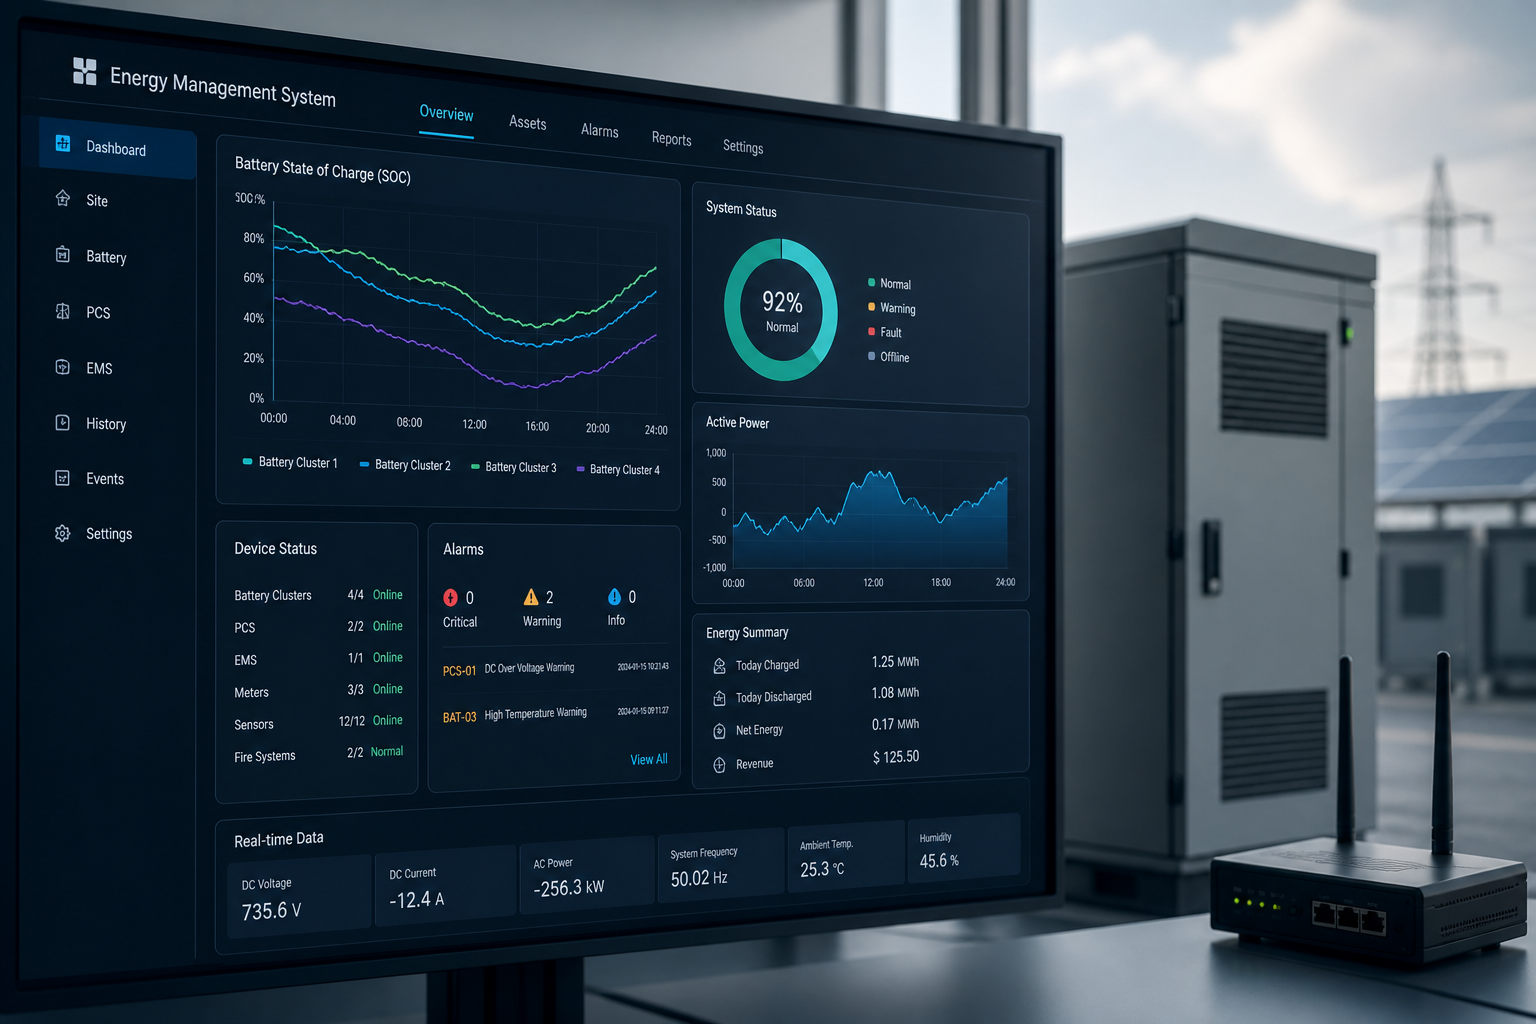
Remote O&M Centre (self-run + low bandwidth monitoring)
Local control
- Local Forecast and Schedule
- Load Priority Execution
- Fault self-healing.
- Local storage of data
Nodal surveillance (TC-REMOTE-07)
SOC
74%148 Ah
Electricity
48 kW48 kWh
Electricity
156 A156 A
Temperature
18°CMin 12°C
Remote monitoring (satellite link 512 kbps)
- Data reporting cycle 5 minutes
- Key parameters are now reported
- Breakpoint
- Logs and Reports Export
Alarms and notifications
- Serious alarm.
- An important alarm.
- General alarm.
- Hint Information
11 / Validation and testing evidence
Survey, simulation, deployment and ongoing validation
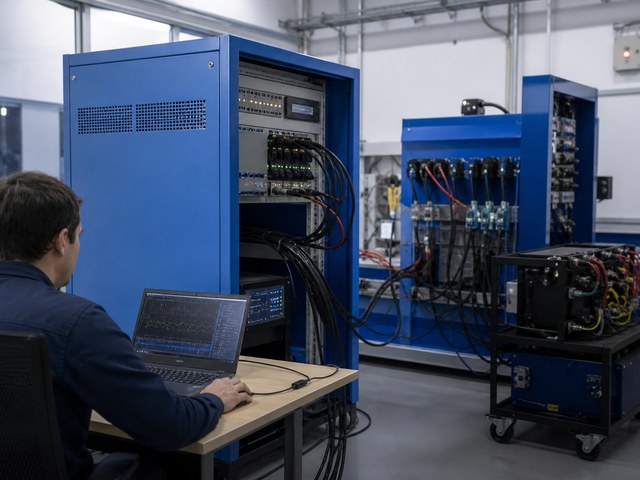
HIL Black Start
- Result
- Pass.
- Indicators
- < 200 ms
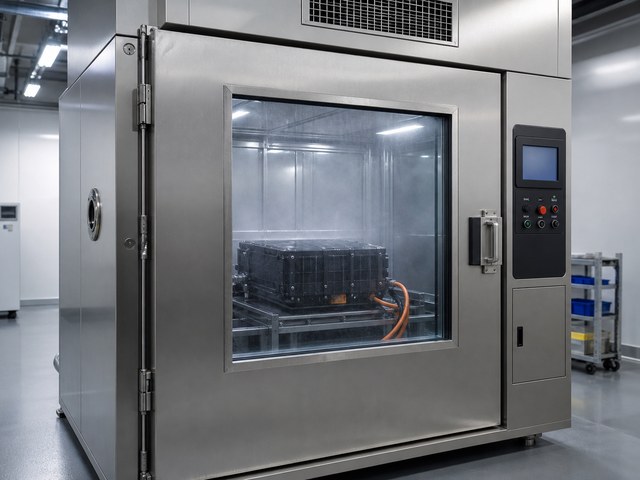
Climate module
- Result
- Pass.
- Indicators
- -40~55°C
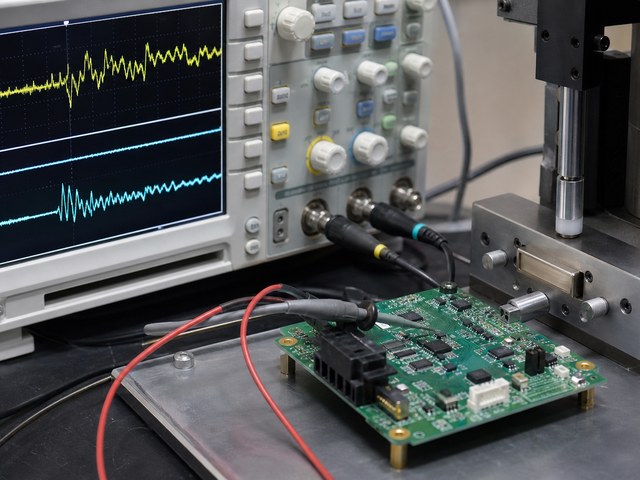
Impact Load
- Result
- Pass.
- Indicators
- 3× In

Plant FAT
- Result
- Pass.
- Indicators
- 100%
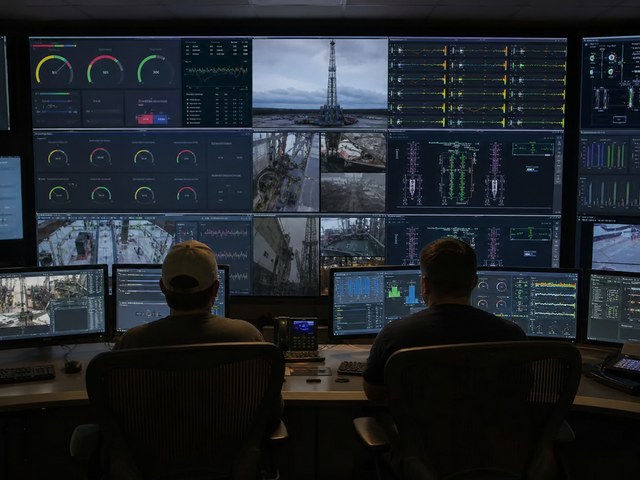
It's been a long time.
- Result
- Pass.
- Indicators
- 720 h
Full load test.
- Result
- Pass.
- Indicators
- 1.0× Pn
NEXT STEP
Combine boundary and delivery path around Off-grid & Remote Power
Programme configuration and implementation tempo can be further confirmed on the basis of on-site loads, netting conditions, installed space and transportation requirements.