Integrated lithium battery energy storage solutions
Maps of residential photovoltaics and household energy scenarios

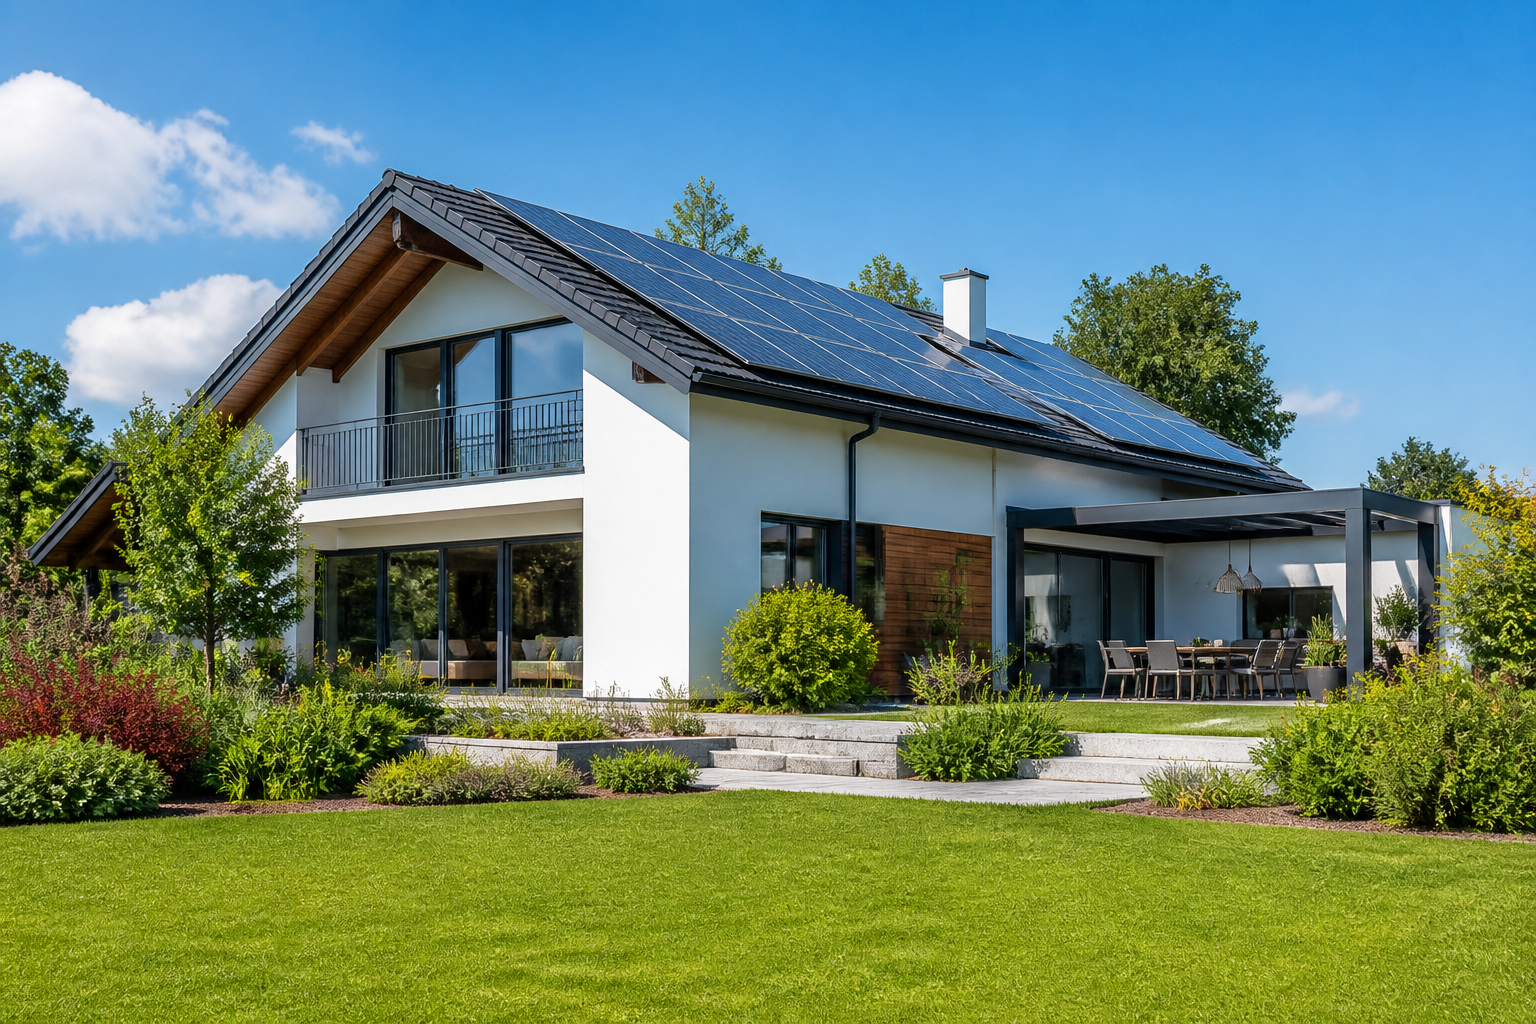
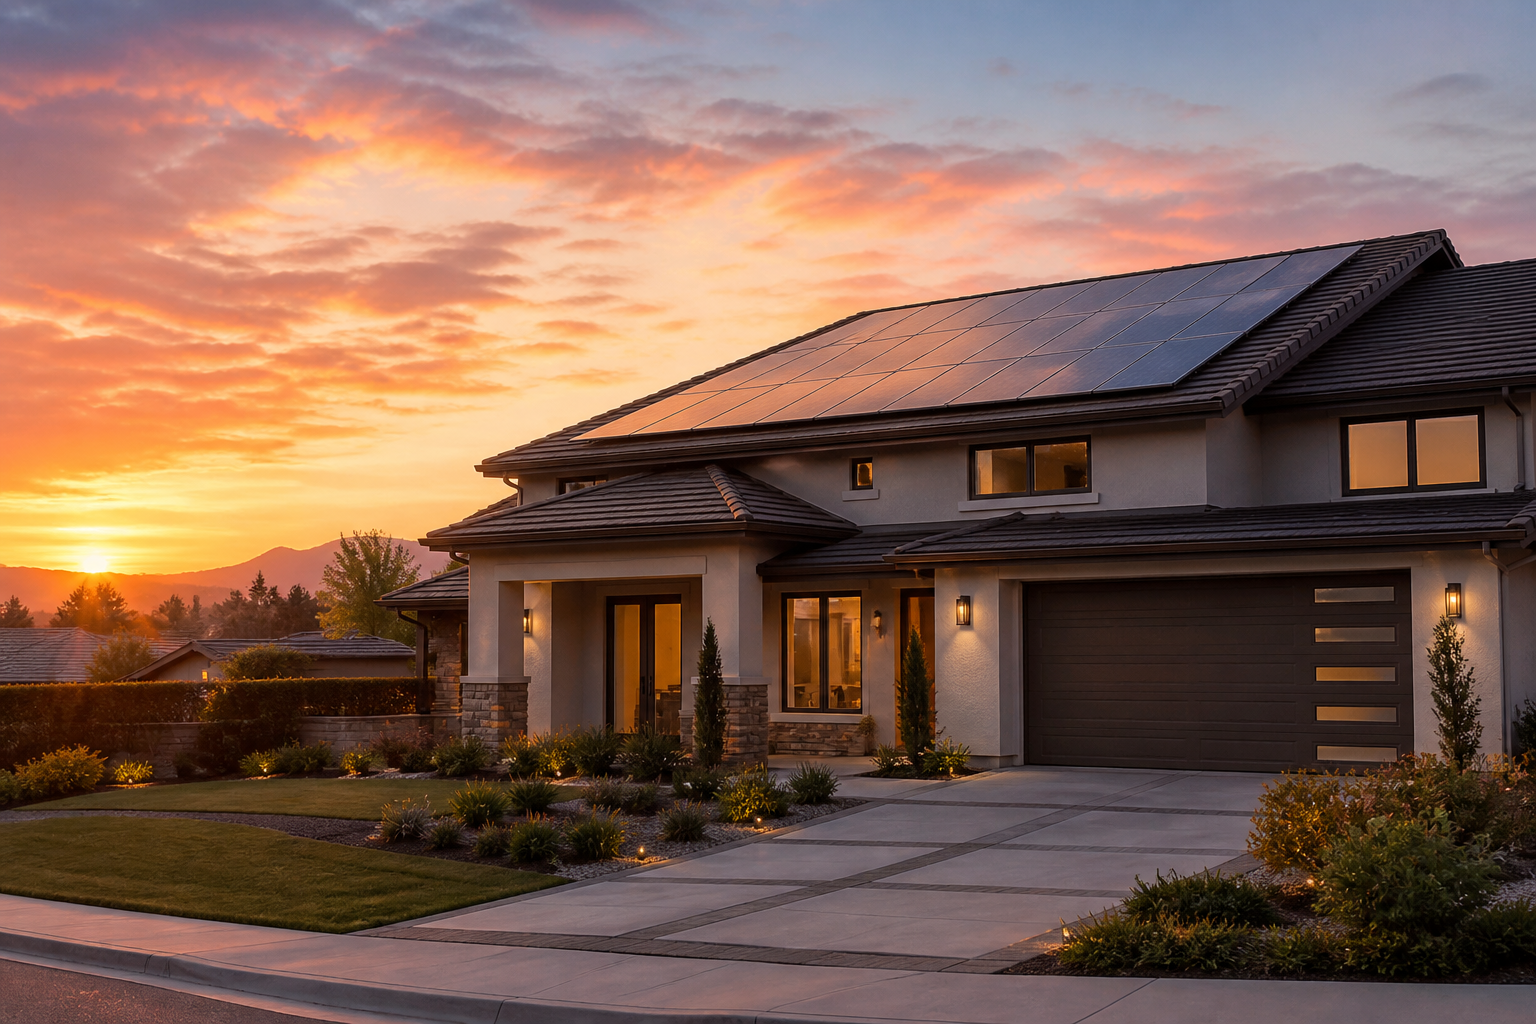
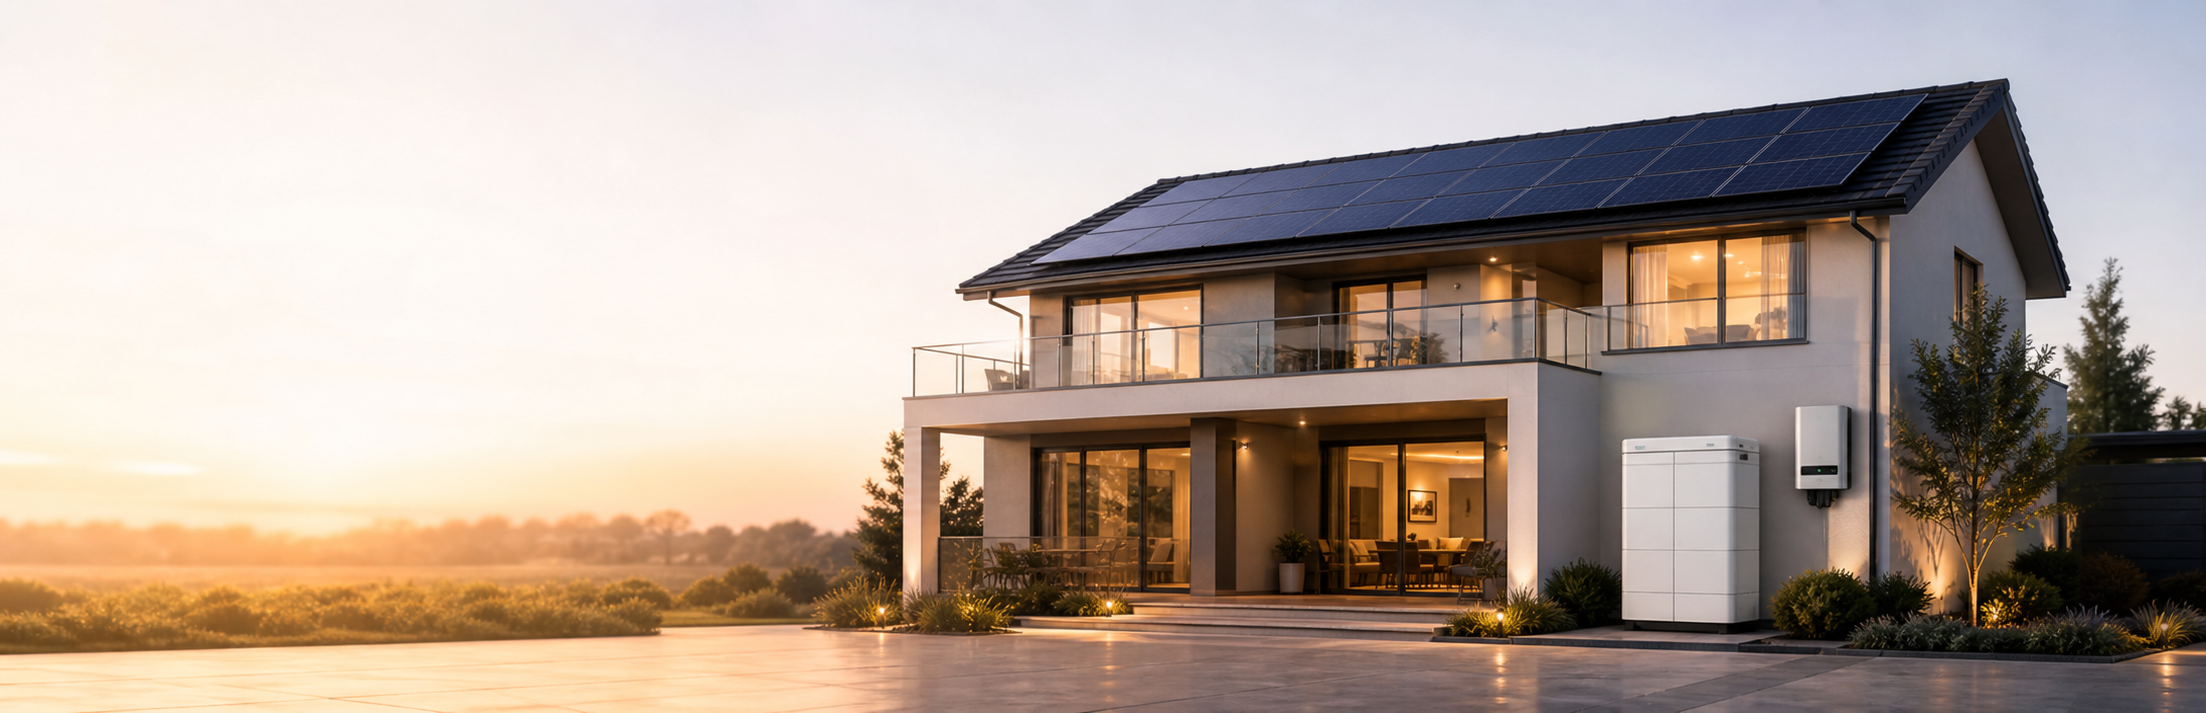
Residential Solar + Storage

And leave the sunlight of the day to the family.

Make every degree of clean electricity more efficient in the home, for use during the day, for surplus storage and at night. At the same time as the cost of electricity is reduced, the necessary back-up power is reserved for households.

12.8 kWp Photovoltaic machines
30.7 kWh Available storage capacity
25% Backup power
86% Self-used ratio
&Normal System State
Photovoltaic priority for self-use Increased self-use and reduced electricity purchases from the grid.
Electricity at Wrong Peak It is stored during the day, in the evening and at night.
Household workload coordination Common management of household electricity, heat pumps and EV charge.
Modular Extension Gradual expansion based on growth in household use.

Systems pounce and energy flow

Optical Array Mixed Reverser Energy batteries Household power distribution / key load Grid Connection Status
AC / DC energyCommunications / Control

The energy flows from sunrise to night. (24-hour energy curve example)

  1. 05:30 Sunrise
  2. 08:00
  3. 12:00
  4. 18:00
  5. 24:00 Night
Morning.

Morning.

Loaded power supply is dominated by grid

It can wait for charge.
At noon.

At noon.

Photovoltaic power sufficient

Priority self-use, surplus storage
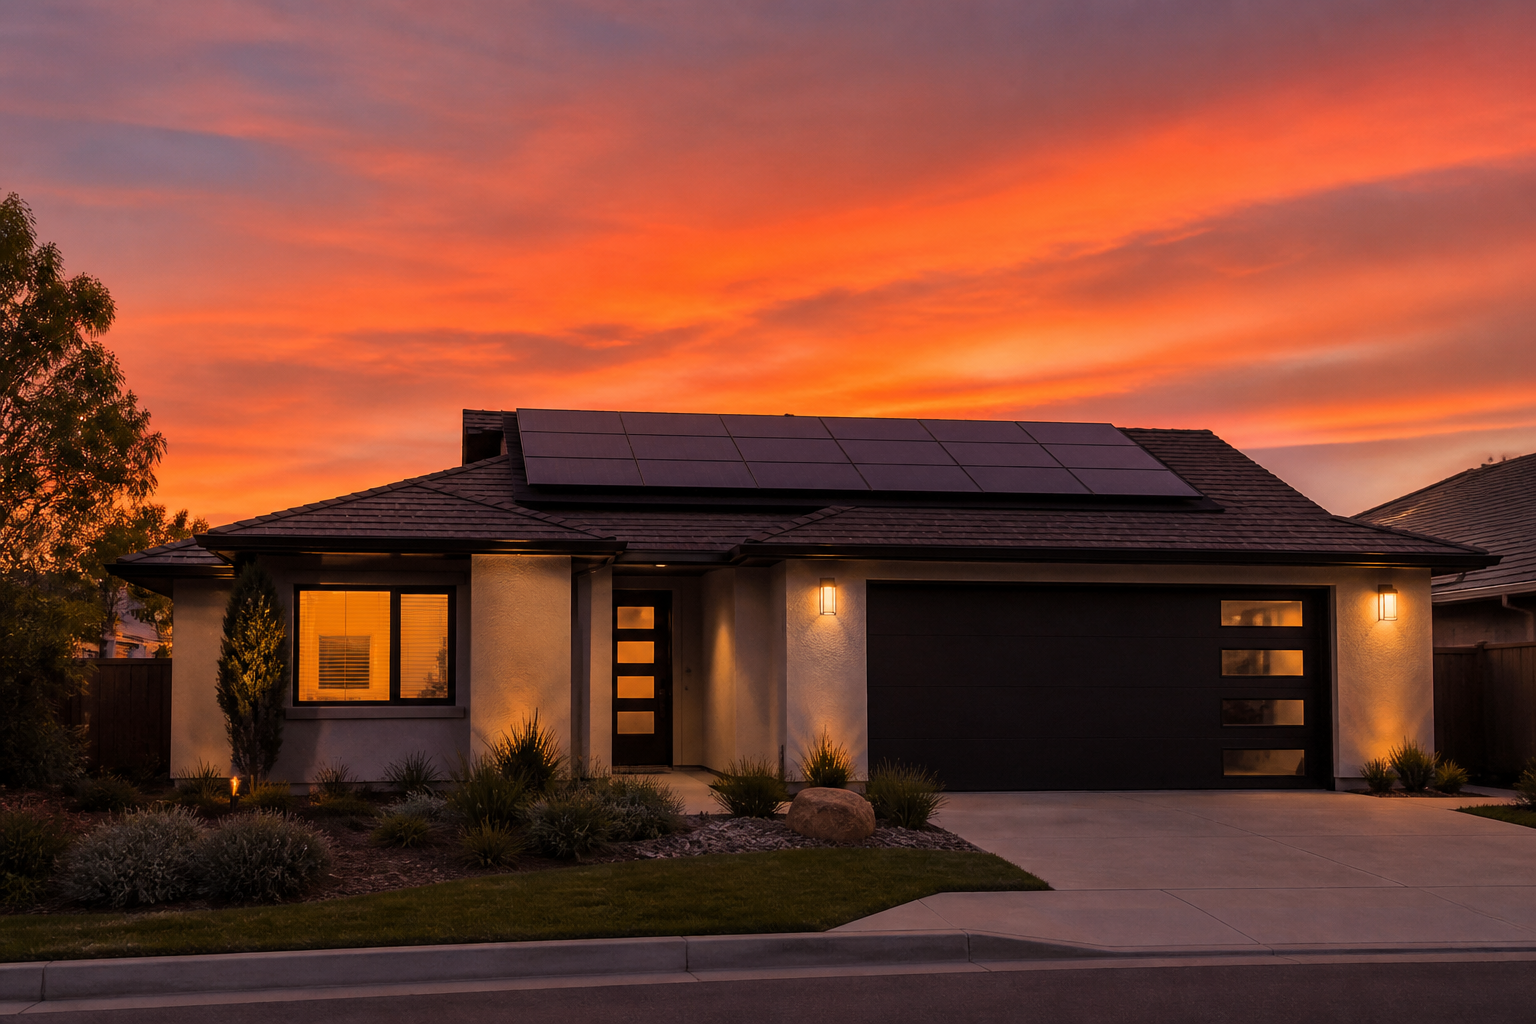
Evening

Evening

The light's dropping.

They can refuel the household load.
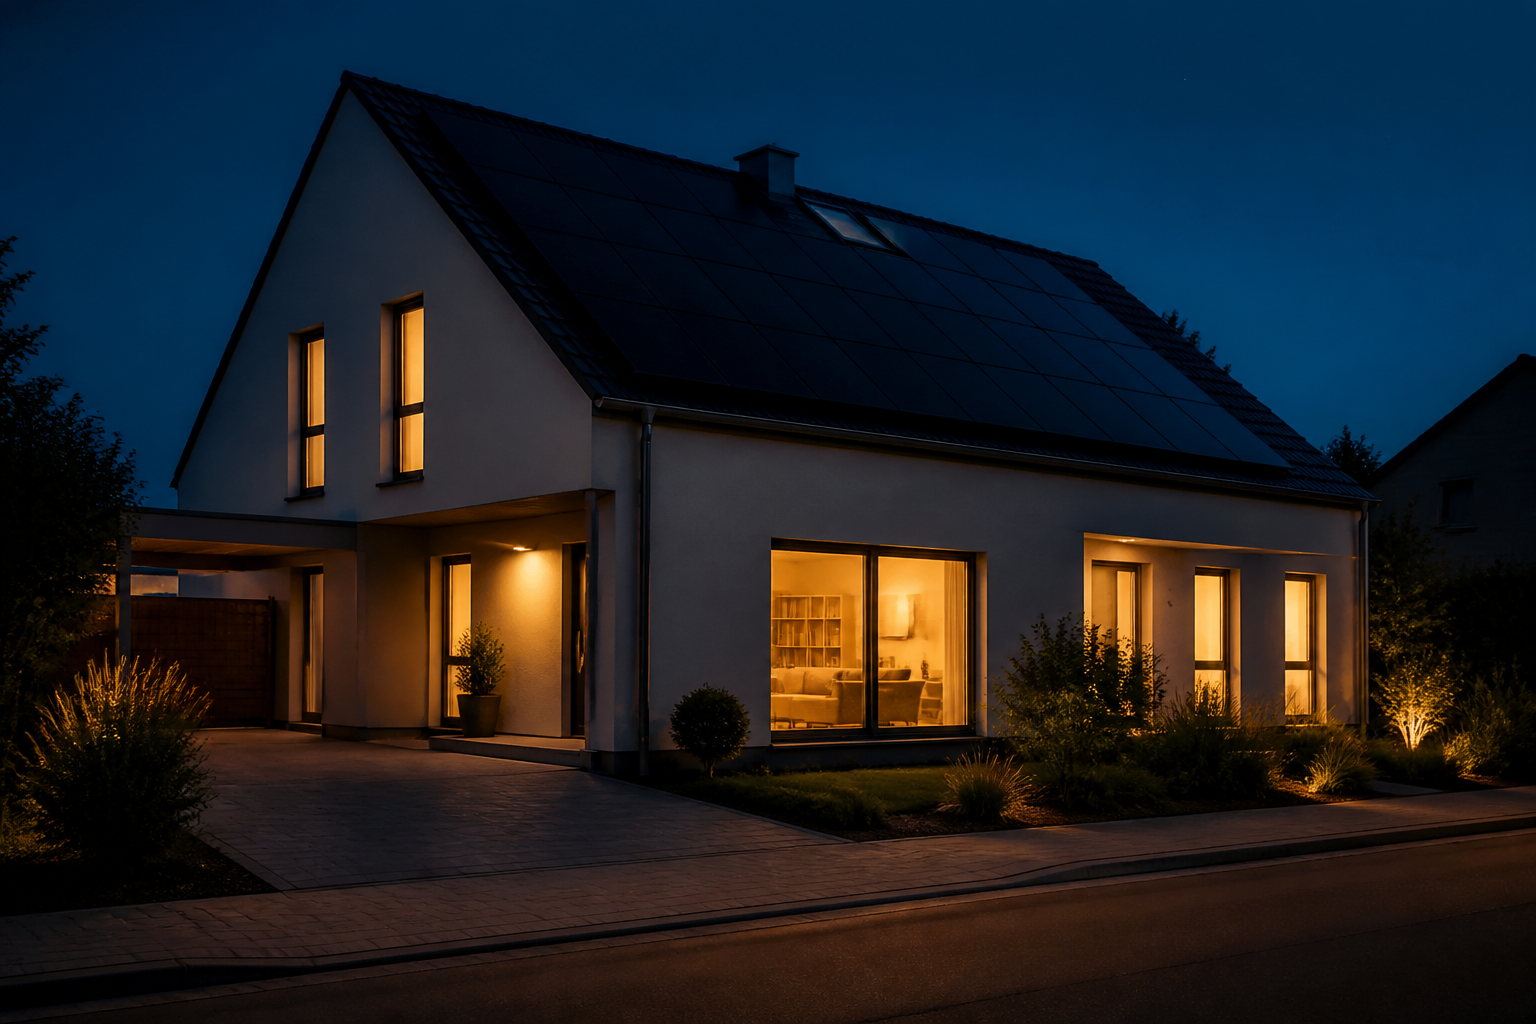
Night

Night

It's the power supply.

Retention of backup power

Daily electricity generation 52.6 kWh
Daily electricity 45.2 kWh
Use rate 86%
Battery charge 7.4 kWh
Photovoltaic power 22.8 kWh
Storage power supply 19.7 kWh
Night subsistence rate 93%

Let the light voltage give priority to the house and leave the rest of the power at night.

1 Photovoltaic priority for immediate residential load
2 The rest of the voltage is charged to the battery.
3 We'll have enough storage to send the grid.
4 Batteries take over household loads in the evening and night
5 Always keep the minimum reserve SOC

Three typical operating scenarios Same system, different weather times.

It's beautiful. There's plenty of light, excess energy into batteries.
Photovolt 12.8kWp
Load 8.9kW
Charge 2.1kW
SOC 59%
The clouds are changing. It's very smooth.
Photovolt 12.8kWp
Load 3.4kW
Batteries 3.8kW
SOC 56%
Evening peak / backup The light voltage is zero and the reserves support the household load.
Photovolt 0kW
Load 4.2kW
Battery discharge 3.6kW
SOC 28%

System configuration and capacity recommendations Example:

Family. (Input examples)

Annual electricity use 6,500 kWh
Peak Load 6.5 kW
Tent space available 75 m²
Head for the roof. South East / Inclination 20°
Key Load 80%
Critical load power 3.0 kW
Long-time target for power supply 12 hours
Expected expansion EV / Heat Pump

System Recommended Range (example)

Optical scale
9 ~ 14 kWp 12.8 kWp
Mixed Reverser
6 ~ 10 kW Recommended 8 kW
Storage capacity
20 ~ 55 kWh 30.7 kWh
Subsidy (SOC)
20 ~ 30 % Recommended 25 %

Key Widget Selection (example)

Equipment Example model Specifications Number
Mixed Reverser TC-H8K 8 kW 1 table
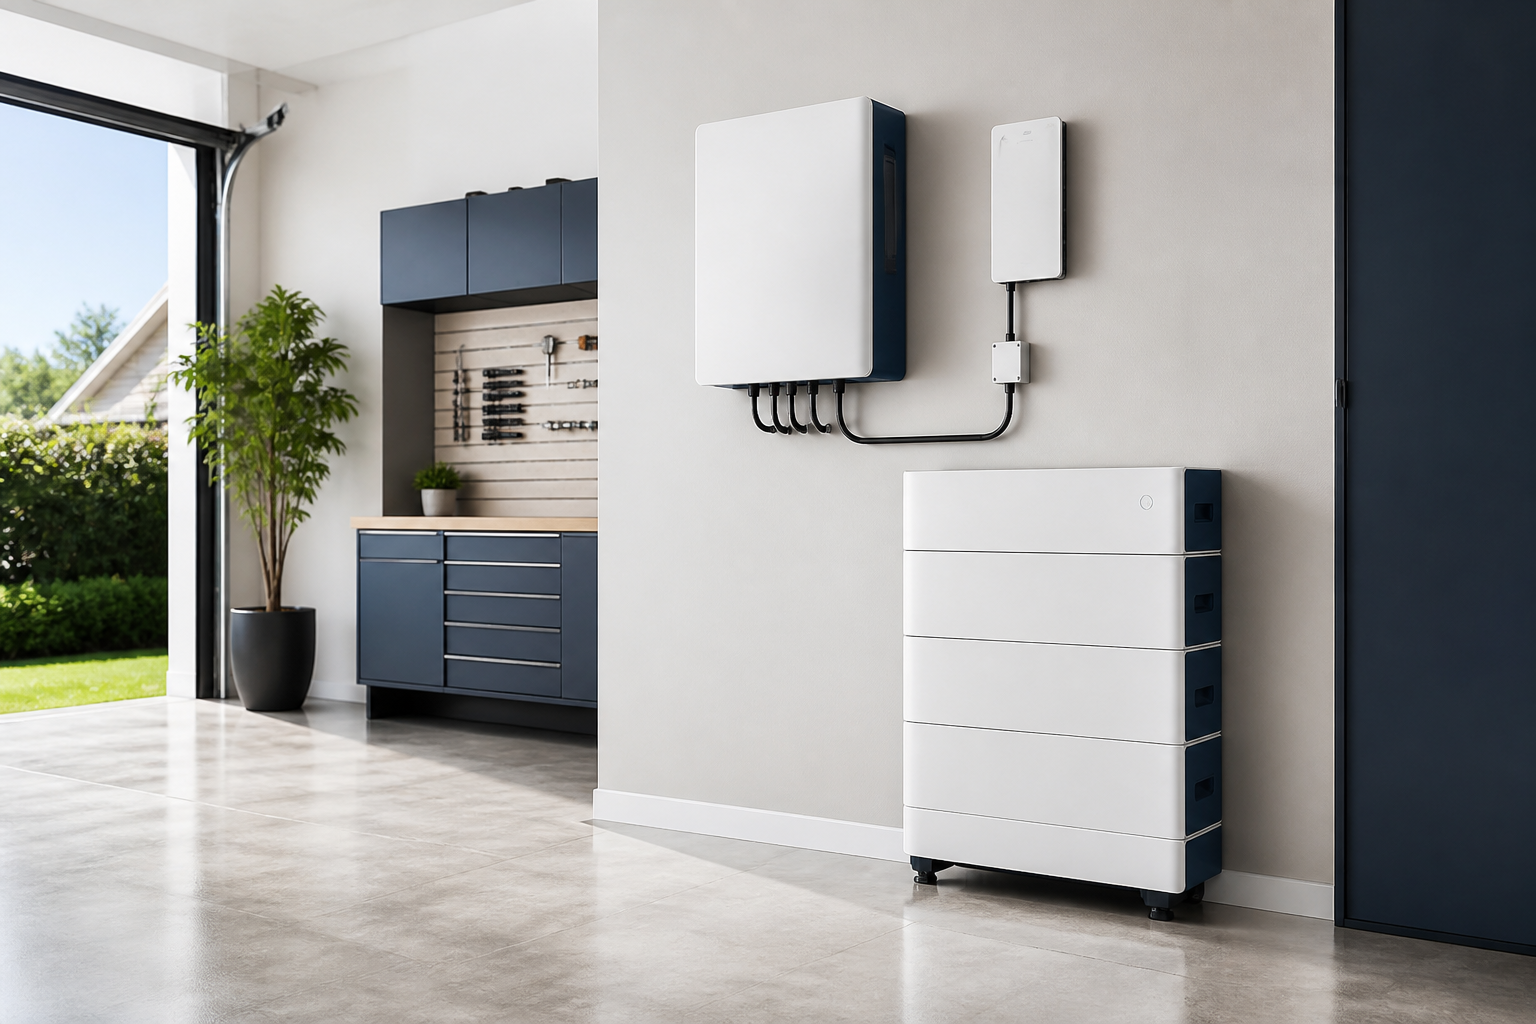
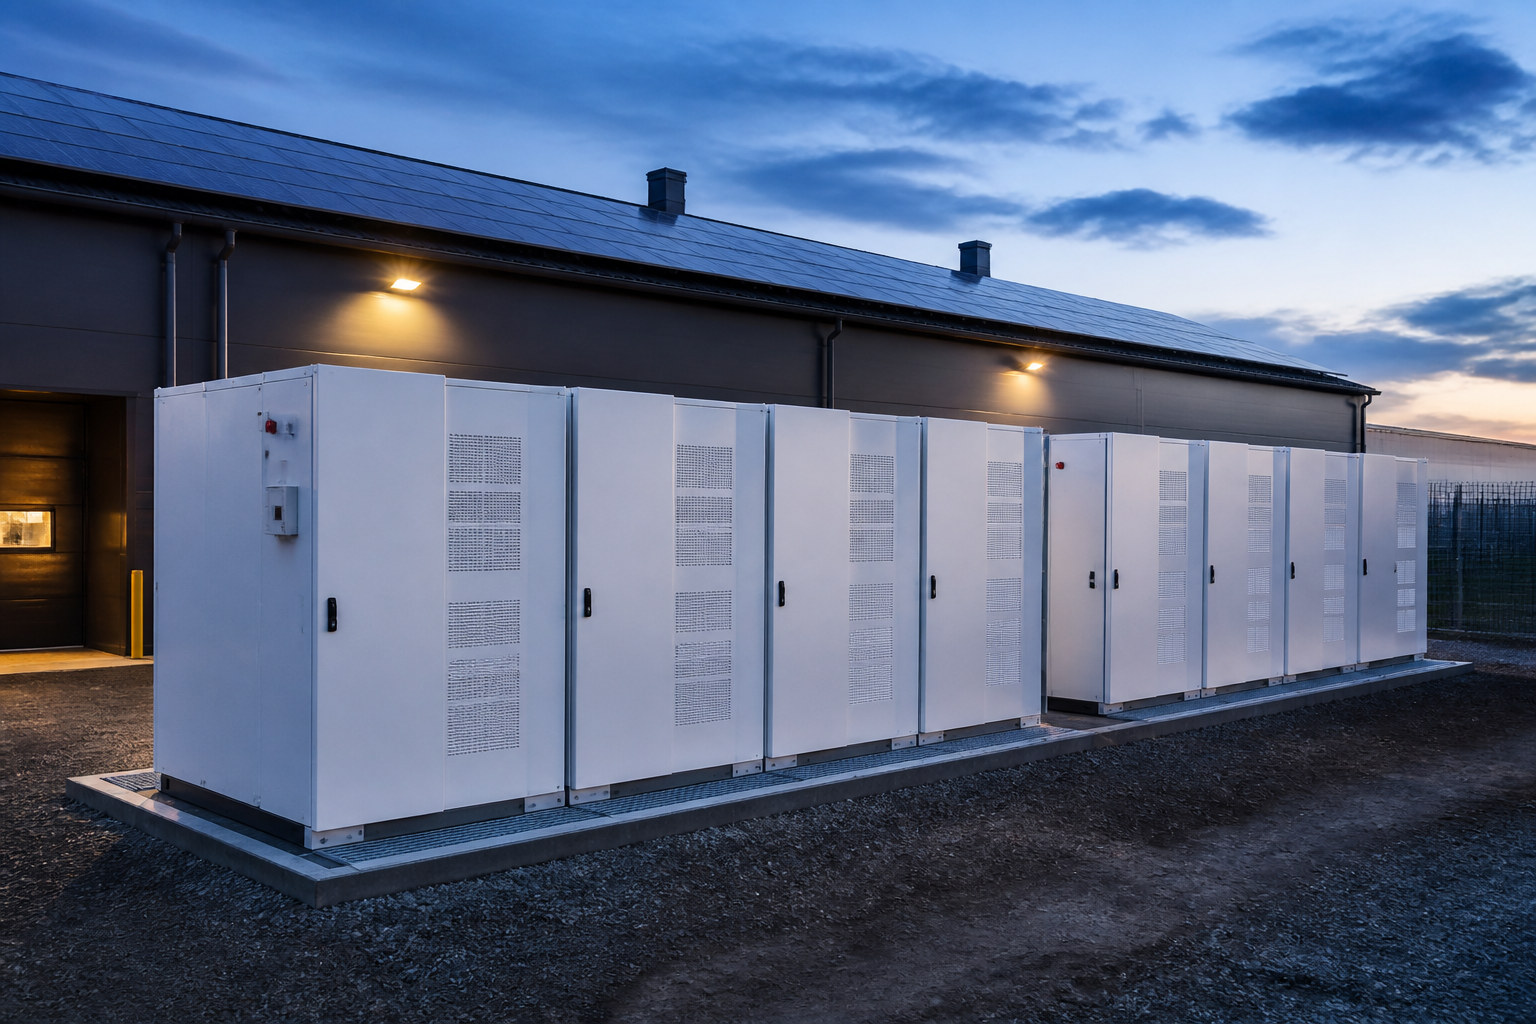
Energy cabinet TC-ES30 30.7 kWh 1 set
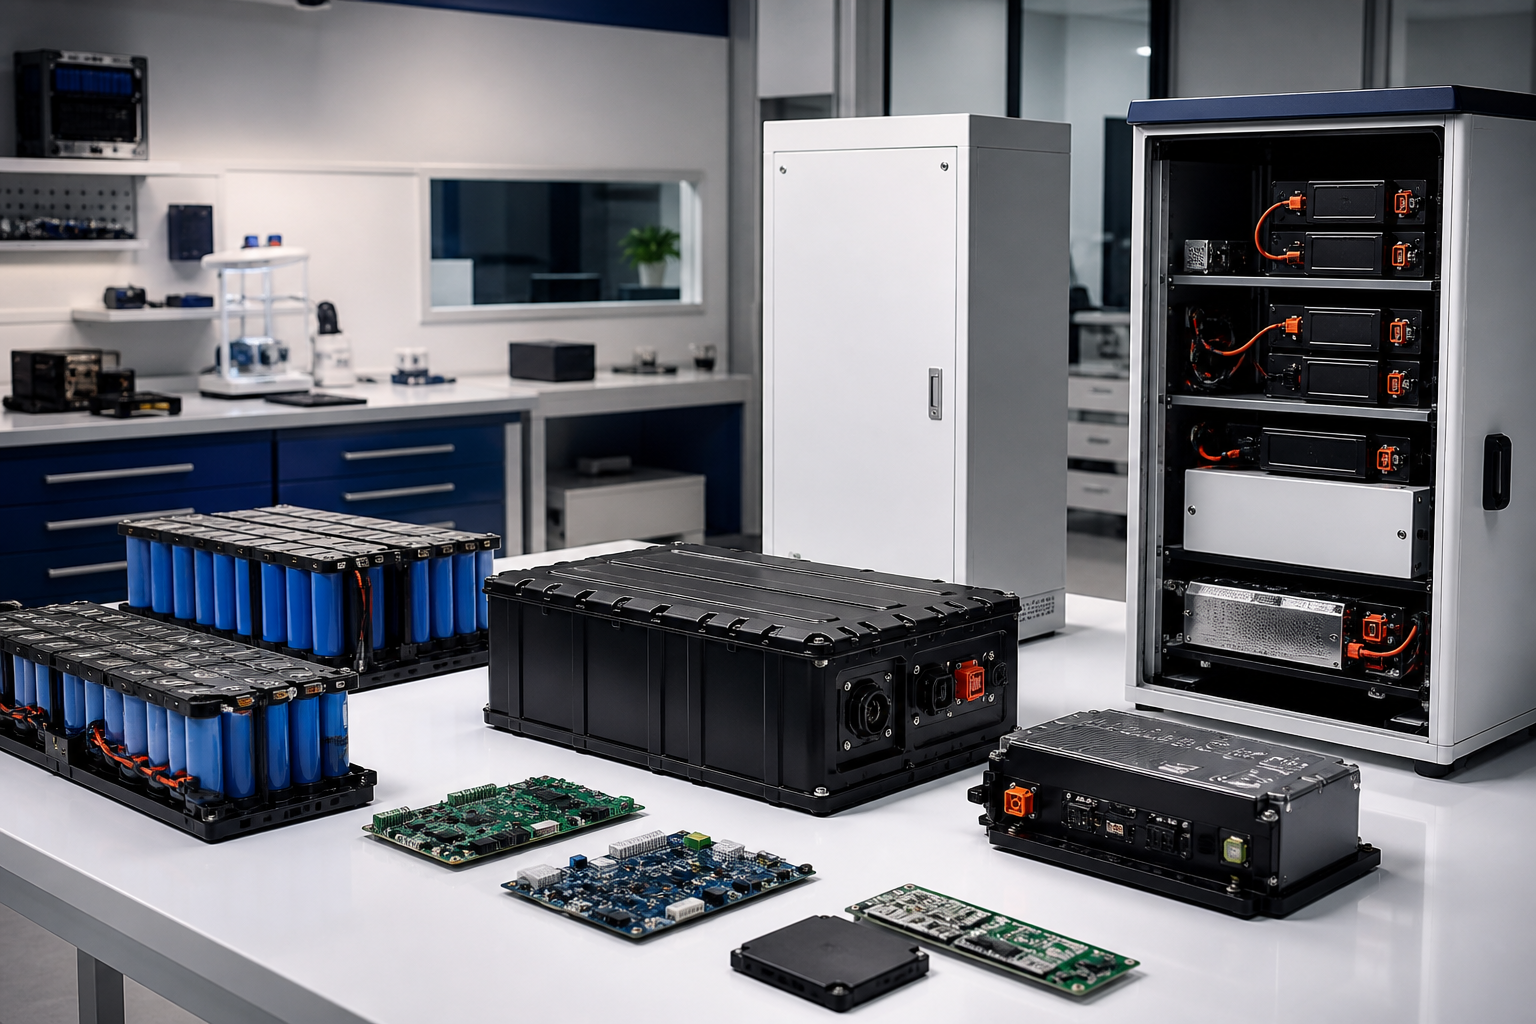
LFP Battery LFP Module 5.12 kWh $6
Photovoltaic Component Component 445W 445 W 29 bucks.

Climate adaptation energy strategy Example:

Three-day weather and power generation projections

Today 26°C Electricity 5.2 kWh
Tomorrow. 29°C Power generation 5.6 kWh
The day after tomorrow. 24°C Power generation 3.8 kWh

Household energy flow curve (Charlotte example)

Critical load security and power outage response Example:

Family load protection

Refrigerator Chile
Lighting Chile
Network Chile
Security Chile
Medical equipment Priority

The power outage response time line

Power outage.
System Switch
Key load power supply
Power grid restoration
25%
SOC
Projected retention 7.7 kWh

Installation and networking implementation

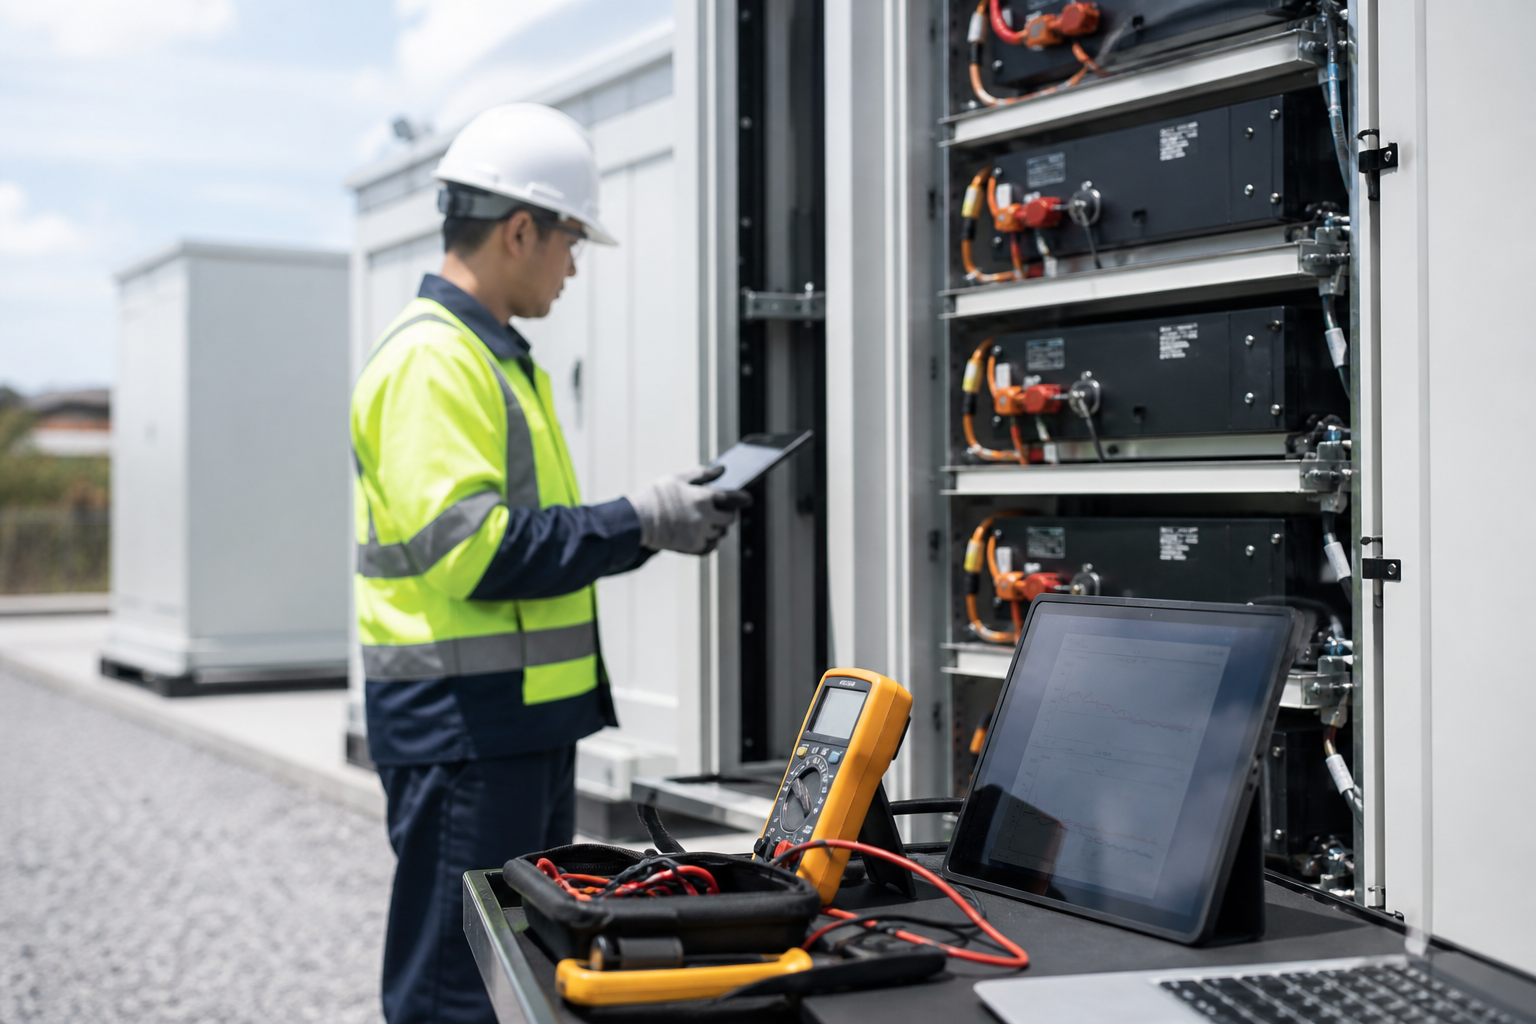
Device setup Identification of the position of the storage cabinet and the reverser
Ventilation and spacing Rehabilitation and safety distance requirements met
Lines and protection AC / DC Protection and Mine Protection Design
Networking Two-way metrology and netting protection test
Debugging and acceptance System connectivity, protection and strategy validation

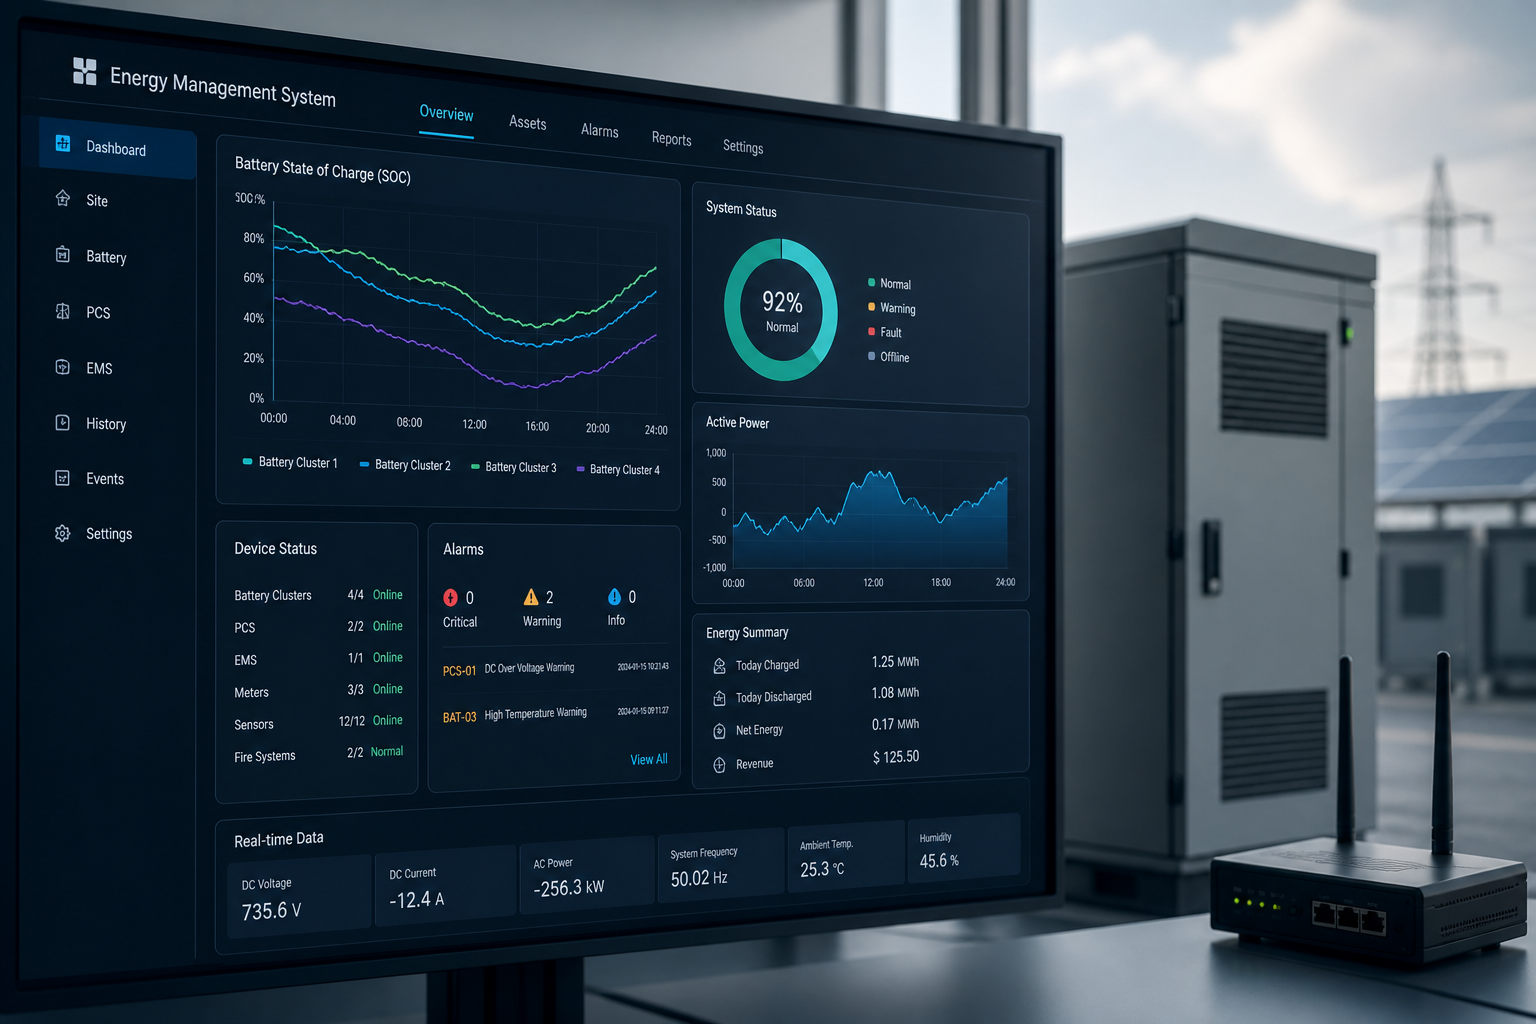
Monitor and Data Viewer Example:

Energy Flow

Photovolt
8.9 kW
Domestic workload
3.8 kW
Battery charge
5.1 kW

Monthly energy analysis (May example)

Electricity purchases 1,582 kWh Self-utility 1,316 kWh Use rate 83% Access to electricity 266 kWh

Mobile monitoring

All Lifecycle Services

Field survey Roof / Power Distribution
Load Image Use it to analyze.
System design Capacity Match
Economics Assessment of benefits
Equipment installation Project implementation
Networking Net acceptance
System delivery User Trading
Operational maintenance Long-term service

List of deliverables Example:

Electrical design Line/ Distribution Chart
Proceed measurement report Self-Use / Power Cost Analysis
Project execution drawings Device / Line / Installation
Protect Parameters Networking/ Device Protection
Debug Record Test / Acceptance Results
User Manual Operations / maintenance / alarms

NEXT STEP

Combine boundary and delivery path around Residential Solar + Status

Programme configuration and implementation tempo can be further confirmed on the basis of on-site loads, netting conditions, installed space and transportation requirements.